Contents
I. Comfort Scores
II. Temperature Extremes
III. Snowfall Statistics
Comfort Scores
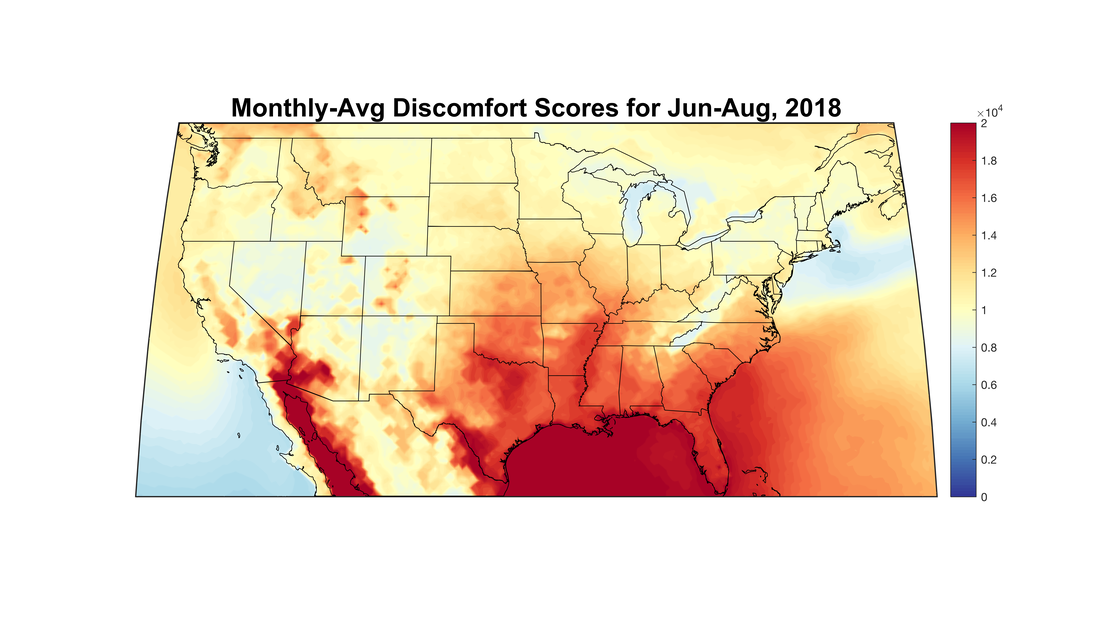
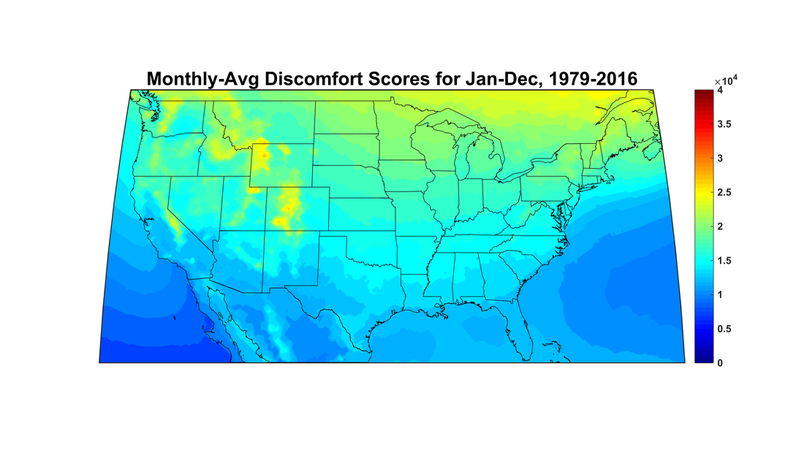
A description of these comfort scores, including the methodology used in defining them, can be found in this blog post from July 2016. The below scores will be updated monthly throughout the year. Scores represent *discomfort*, so that red is most uncomfortable and blue most comfortable. Therefore in warm seasons and regions blue generally means cooler-than-average weather, while in cold seasons and regions it means anomalous warmth. A perfect score, by this measure, would constitute a month wherein nighttime temperatures always ranged between 64 and 70 F, with daytime temperatures always between 70 and 80 F. In general, these scores can be reasonably well approximated from the seasonal average of the temperature percentiles shown in the NOAA Global Climate Report.
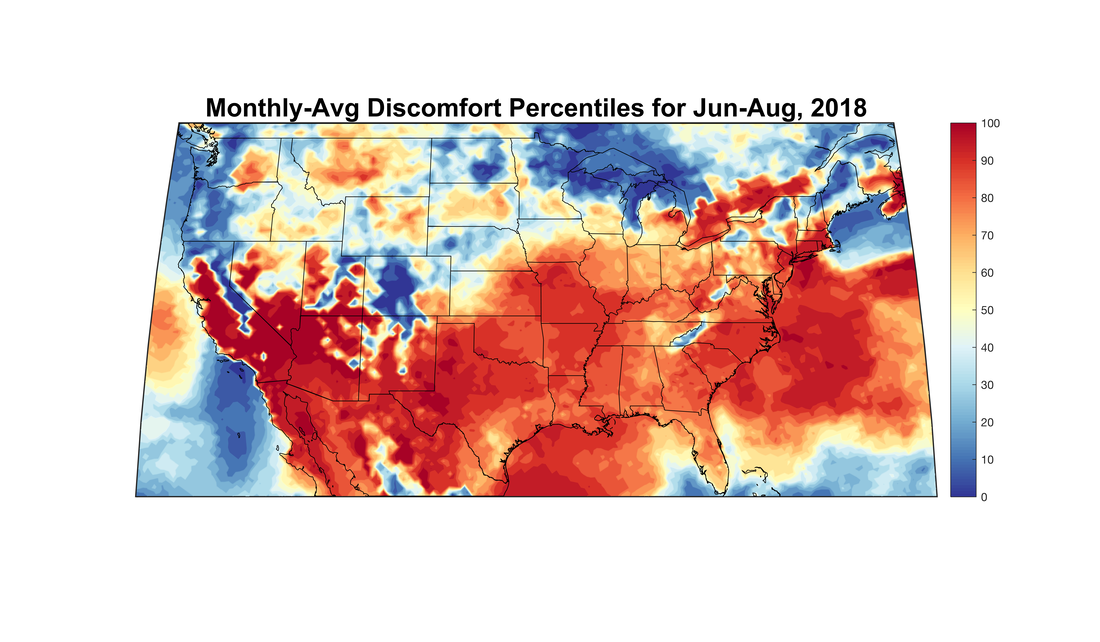
Summer 2017 was characterized by warm temperatures in the southeastern and southwestern parts of the country, in association with very high SSTs in the Gulf of Mexico, western Atlantic, and Gulf of California, but there was a distinct lack of sustained heat across the Midwest and Northeast. Thus, the coastal Southeast US experienced highly uncomfortable weather (and Miami set dozens of record highs, primarily minima), central sections of the country were near normal or significantly more comfortable than average. Parts of eastern Canada were uncomfortable due to cooler-than-average conditions.
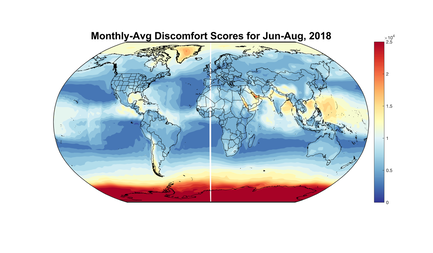
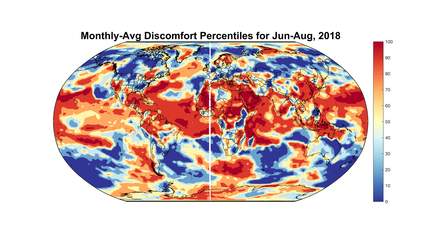
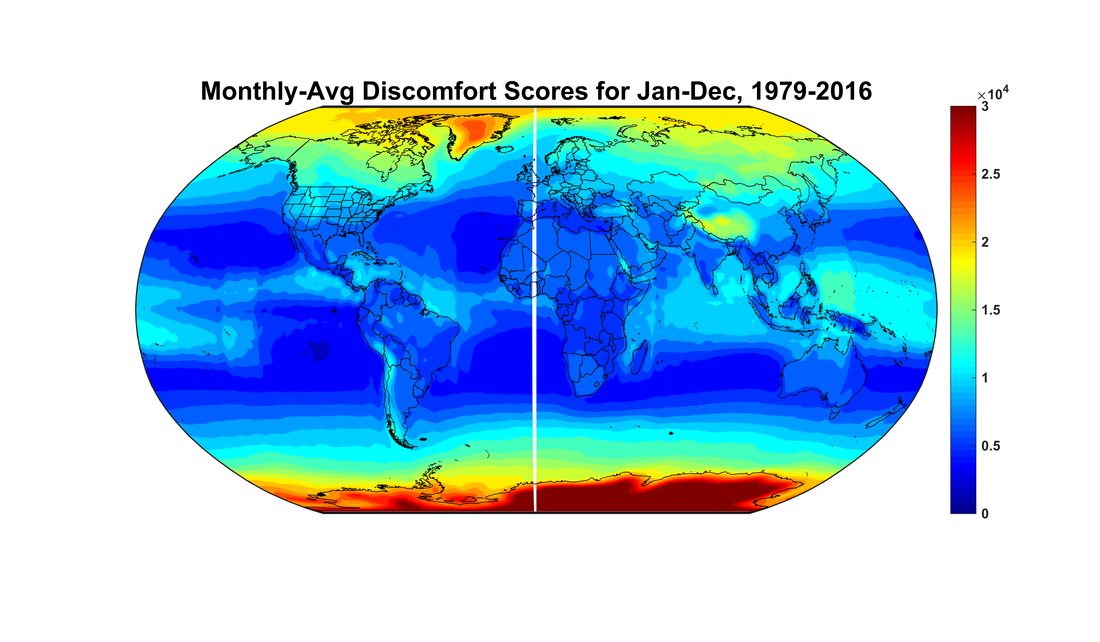
Worldwide, the typical discomfort hotspots of Greenland, the Persian Gulf, and Antarctica again were out in full force. High SSTs in the western Pacific and northern Indian oceans contributed to even greater heat and humidity in these areas and in adjoining land areas than is typical. The most comfortable areas were the subtropical ocean gyres and assorted other continental regions generally around 40 N in the Northern Hemisphere and 20 S in the Southern Hemisphere. High precipitation made India and China less comfortable than in previous iterations of the calculation. Northern Africa and Arabia experienced high discomfort resulting from high temperatures, as did much of the tropical oceans — considering the slow and steady rise of SSTs, this is to be expected, as is the jumpiness of land temperatures from season to season and year to year. The normally cold mid-latitude Southern Hemisphere oceans were very comfortable this year, by the same token, as were subpolar areas in the Northern Hemisphere. Given that the worldwide average temperature increase of about 2 F since 1900 is not insubstantial compared to the size of the ideal temperature ranges (64-70 F at night and 70-80 F during the day), it's not surprising that such a clear global picture would emerge even just since 1979, with the tropics regularly much more uncomfortable than ever before, and normally cool or cold areas generally so much better.
Summer 2017 was characterized by warm temperatures in the southeastern and southwestern parts of the country, in association with very high SSTs in the Gulf of Mexico, western Atlantic, and Gulf of California, but there was a distinct lack of sustained heat across the Midwest and Northeast. Thus, the coastal Southeast US experienced highly uncomfortable weather (and Miami set dozens of record highs, primarily minima), central sections of the country were near normal or significantly more comfortable than average. Parts of eastern Canada were uncomfortable due to cooler-than-average conditions.
Worldwide, the typical discomfort hotspots of Greenland, the Persian Gulf, and Antarctica again were out in full force. High SSTs in the western Pacific and northern Indian oceans contributed to even greater heat and humidity in these areas and in adjoining land areas than is typical. The most comfortable areas were the subtropical ocean gyres and assorted other continental regions generally around 40 N in the Northern Hemisphere and 20 S in the Southern Hemisphere. High precipitation made India and China less comfortable than in previous iterations of the calculation. Northern Africa and Arabia experienced high discomfort resulting from high temperatures, as did much of the tropical oceans — considering the slow and steady rise of SSTs, this is to be expected, as is the jumpiness of land temperatures from season to season and year to year. The normally cold mid-latitude Southern Hemisphere oceans were very comfortable this year, by the same token, as were subpolar areas in the Northern Hemisphere. Given that the worldwide average temperature increase of about 2 F since 1900 is not insubstantial compared to the size of the ideal temperature ranges (64-70 F at night and 70-80 F during the day), it's not surprising that such a clear global picture would emerge even just since 1979, with the tropics regularly much more uncomfortable than ever before, and normally cool or cold areas generally so much better.
|
US Scores: Most-Recent Season
|
World Scores: Most-Recent Season
|
Percentiles Relative to Climatology: Most-Recent Season
|
Percentiles Relative to Climatology: Most-Recent Season
|
Climatology
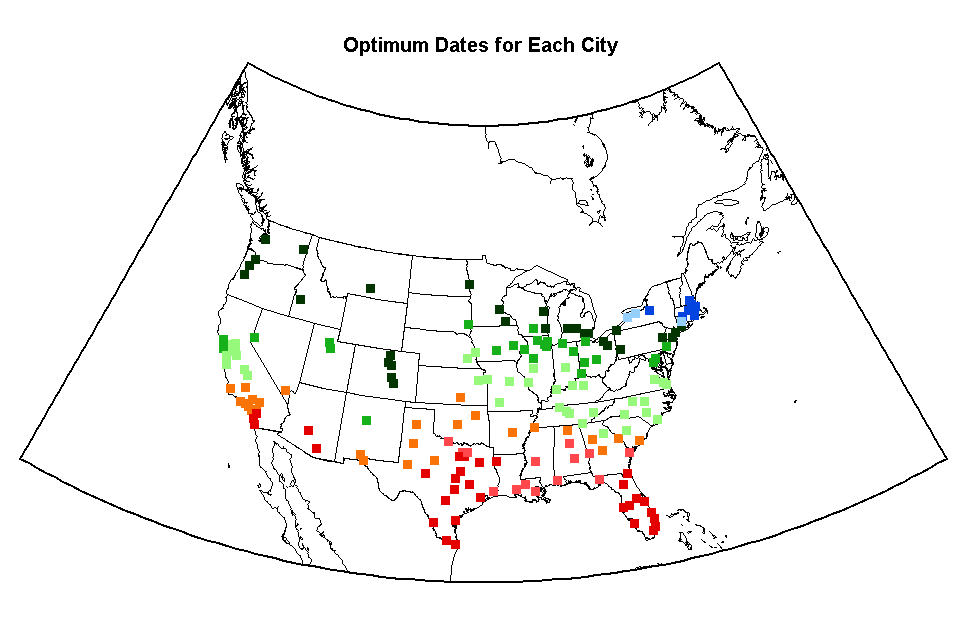
Climatologically optimal dates for each U.S. city >100,000.
In the above figure:
dark red: late Nov-late Mar
light red: early Apr/early Nov
orange: late Apr/late Oct
light green: early May/early Oct
green: late May/late Sep
dark green: early Jun/early Sep
light blue: late Jun/late Aug
dark blue: early Jul/early Aug
purple: late Jul
dark red: late Nov-late Mar
light red: early Apr/early Nov
orange: late Apr/late Oct
light green: early May/early Oct
green: late May/late Sep
dark green: early Jun/early Sep
light blue: late Jun/late Aug
dark blue: early Jul/early Aug
purple: late Jul
Temperature Extremes
On a visit to San Antonio, TX this past January I had the odd experience of strolling the Riverwalk in below-freezing temperatures. In addition to having to hunker down inside for much of the day, the fact that this chilly, breezy weather occurred at 29.4 deg N and only 650' elevation got me thinking about the coldest it's ever been at that latitude so close to sea level. Some cursory research for San Antonio turned up a reading of 0 F in 1949 and a more-recent 6 F in 1989. I wondered, could a 0 F reading have ever occurred anywhere closer to the Equator? The hunt for the tropical cold was on. For completeness, I also ran the calculation to find the locations and values of the hottest temperatures at every latitude.
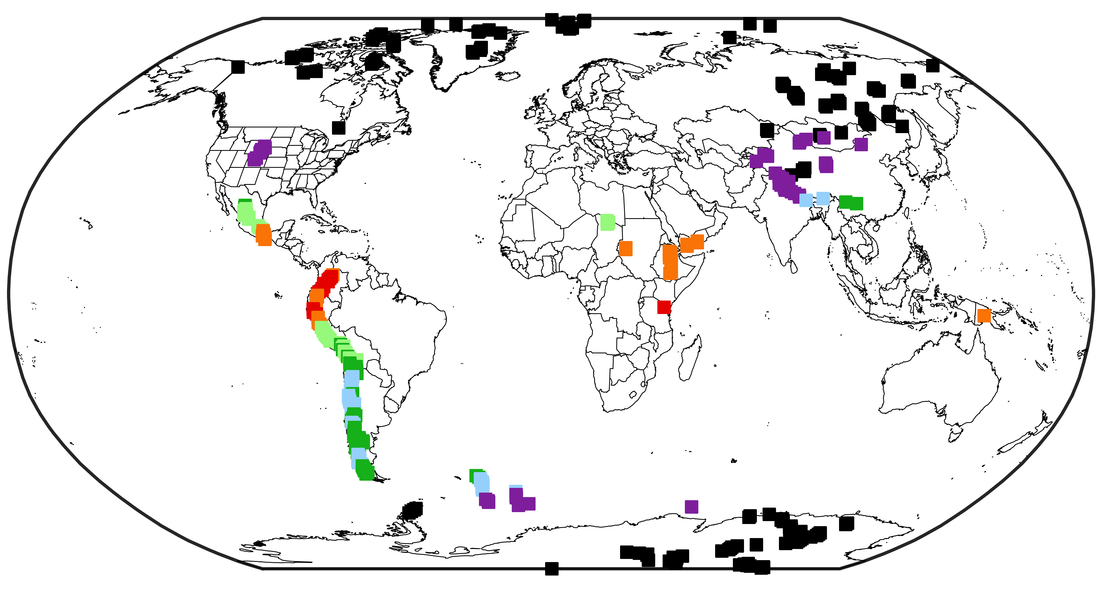
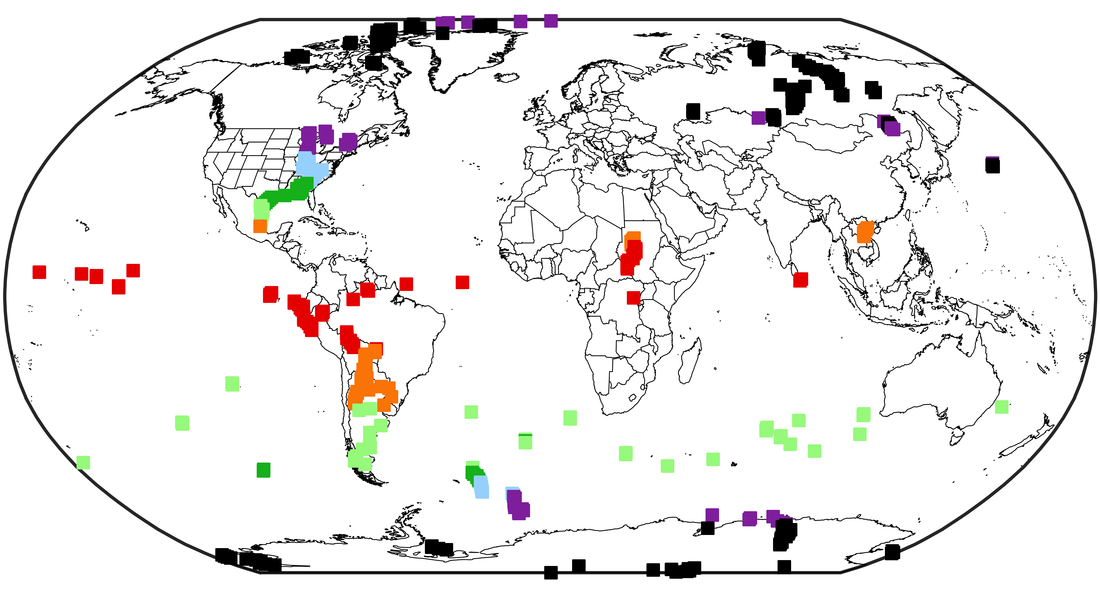
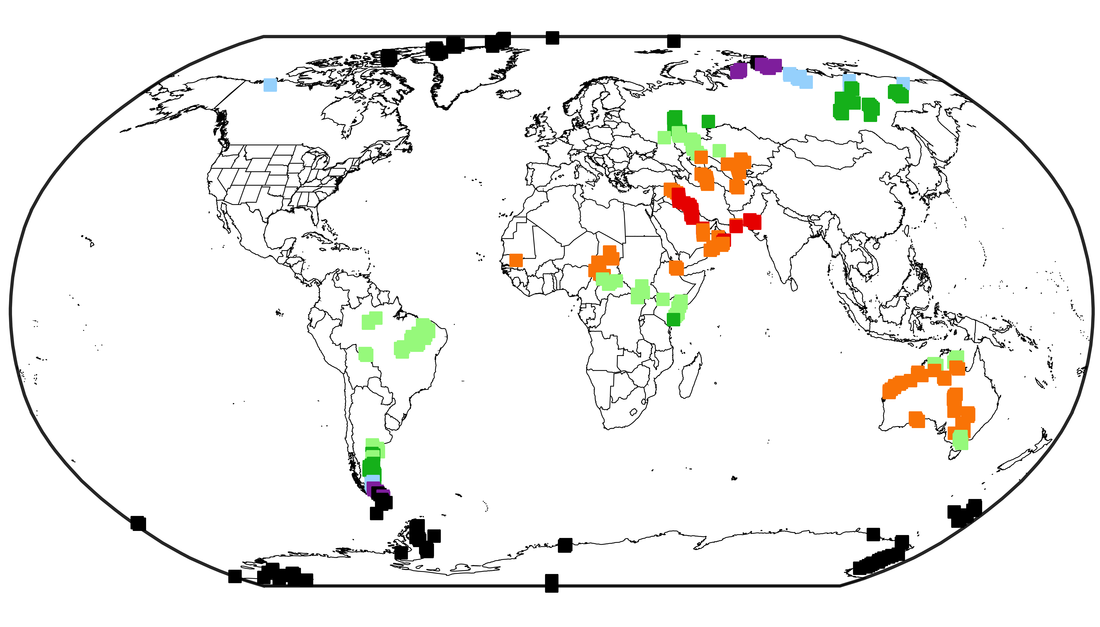
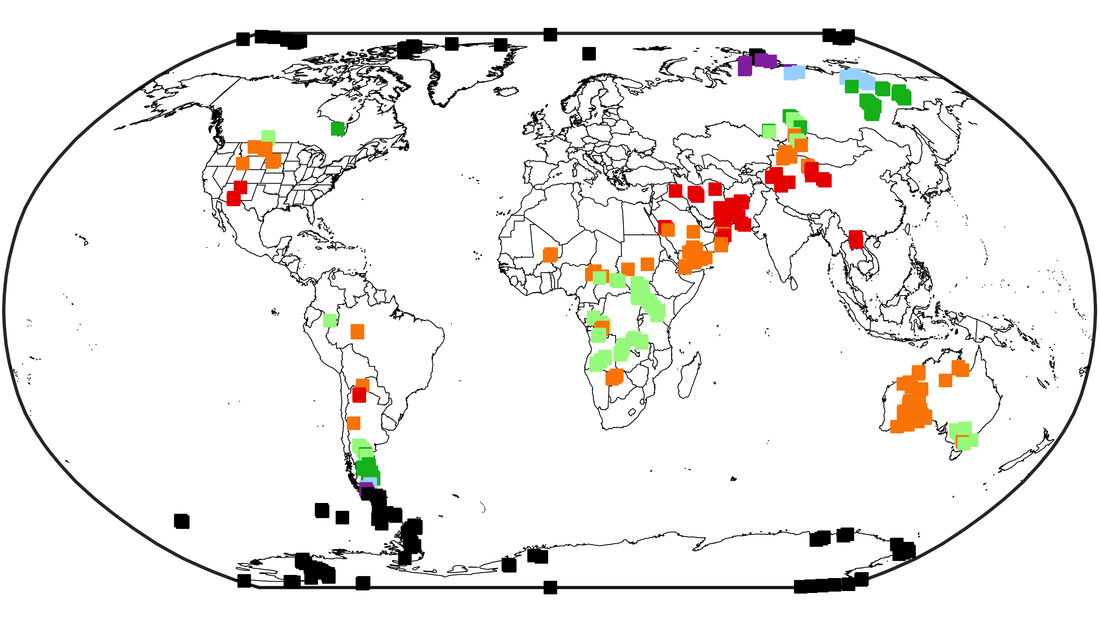
Using ERA-Interim reanalysis data for 1979-2016 at 6-hourly, 0.5-deg resolution, I produced maps of where the coldest (top panel) and hottest (bottom panel) temperatures observed at each latitude occurred, and what those temperatures were. I did this both taking elevation into account (the actual 2-m temperatures, at left) and ignoring it (the 1000-mb temperatures, at right). Below the figures are some observations of the most-interesting features.
Using ERA-Interim reanalysis data for 1979-2016 at 6-hourly, 0.5-deg resolution, I produced maps of where the coldest (top panel) and hottest (bottom panel) temperatures observed at each latitude occurred, and what those temperatures were. I did this both taking elevation into account (the actual 2-m temperatures, at left) and ignoring it (the 1000-mb temperatures, at right). Below the figures are some observations of the most-interesting features.
Coldest Temperature by 0.5-Deg Latitude Band
Color Scale: Red: >7.5 C; Orange: >-2.5 C; Light Green: >-12.5 C; Dark Green: >-22.5 C; Blue: >-32.5 C; Purple: >-42.5 C; Black: <=-42.5 C
|
|
Hottest Temperature by 0.5-Deg Latitude Band
Color Scale: Red: >50 C; Orange: >45 C; Light Green: >40 C; Dark Green: >35 C; Blue: >30 C; Purple: >25 C; Black: <=25 C
|
|
Some observations, arranged approximately from north to south:
-The high variability of eastern Siberia is apparent, with both the hottest and coldest temperatures at those latitudes being observed there.
-Normalized for elevation, the eastern U.S. experiences the coldest temperatures at its latitudes. Most of the records shown here were set on Jan 20 or 21, 1985, when e.g. the Atlanta airport recorded a low temperature of -8 F (-22 C) and Chicago recorded -27 F (-33 C). This pattern extends down into eastern Mexico, confirming my initial hypothesis that 0 F in San Antonio is as cold as one could ever expect at such a southerly latitude.
-Also normalized for elevation, the Rockies and the mountains of central Asia get unusually hot for their latitudes, due to the influence of strong summer high pressures. In actual terms, however, the Caspian Sea and Persian Gulf areas stand out.
-In the tropics, elevation dominates where the coldest and hottest temperatures are observed. Also, record-high temperatures in the deep tropics (on the order of 40 C) are considerably lower than in the arid subtropics, where large areas have hit 45 C or higher.
-All of Australia gets hotter than either of the other two subtropical southern landmasses. Ditto for cold in South America.
-In the southern mid-latitudes, there is not enough land for the same wintertime cold high-pressure systems insulated from marine effects as in the North, leading to the coldest temperatures at 1000 mb being spread out across both land and ocean, likely in connection with intense storms. On the other hand, the hottest temperatures are as expected confined to the narrow tip of South America stretching across to the Antarctic Peninsula, though with values that are much cooler than at the equivalent latitudes in the Northern Hemisphere.
Historical Snowfall Statistics
|
|
|