|
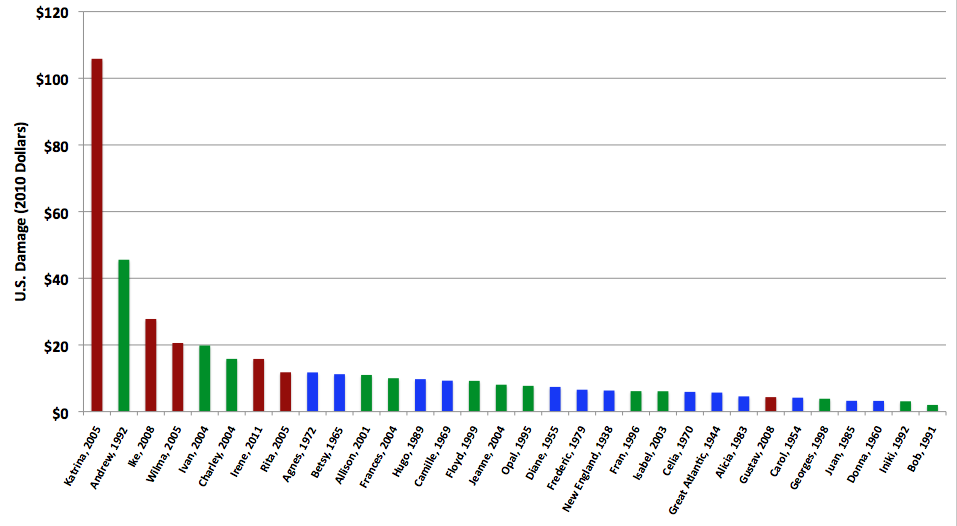
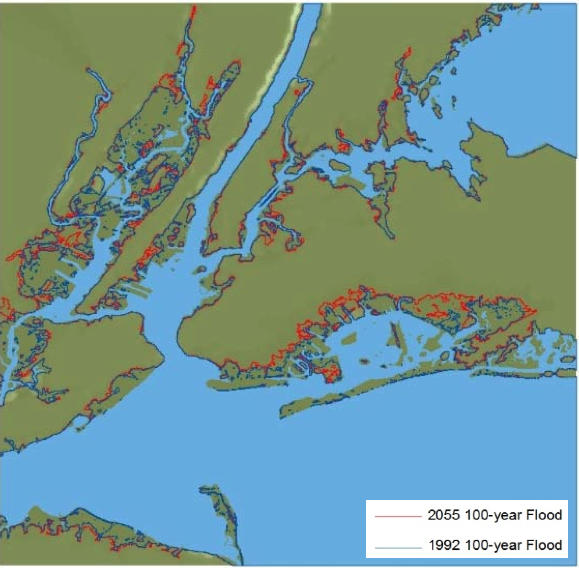
If one were to suffer the misfortune of being sat down and forced to watch CNN nonstop 14 hours a day, it would certainly seem to unequivocally be the case that climate extremes are increasing in frequency and severity, and all around the globe — whether the (anomalous temporary southward shift of the circum-) polar vortex or the routine landfall of a hurricane. Less-breathless approaches to examining the world have also generally found this to be the case, though the rate of change is relatively modest compared to the frenzy of the 24-hour news cycle, and the overall picture is much more nuanced. For instance, high interannual variability means that one often-used climate-extremes index has only in the last 10 years began to routinely exceed maxima from earlier in the 20th century (see figure below; this is termed the 'emergence of a warming signal'). The index considers the percentage of the United States experiencing very high temperatures, very low temperatures, severe drought, and heavy precipitation. In another high-pitched, frenetic world this sort of gauge is known as the "fear index"; with that analogy in mind this is the first in a series of posts taking a measured look at world cities' exposure to climate extremes in the observational record up to the present, and how that exposure might change in the future. 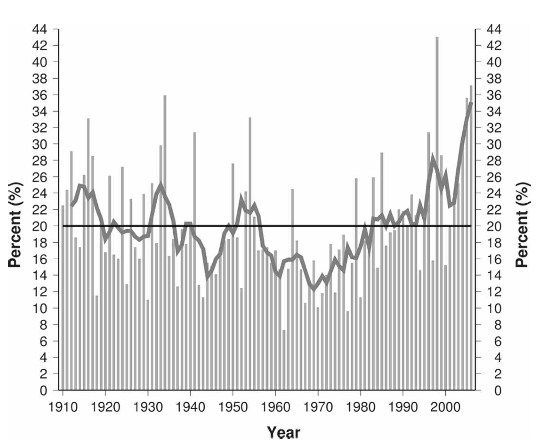 Percentage of the U.S. experiencing extreme (>90th pct or <10th pct) conditions, averaged over the variables of maximum temperature, minimum temperature, drought, and high precipitation. Index is defined so that the average for the period is 20%. Source: Gleason et al. 2007. As discussed in the previous post, coasts are complicated, and only getting more so with sea-level rise and coastal flooding becoming of greater concern. But we don't abandon them and leave them to sort out their own problems because they are useful to us, and so we've built many of our most impressive accomplishments as a species along them. Therefore, landmark places from Shanghai to San Francisco to Sarawak regularly experience flooding (as can be discerned from the fact that these three spots, selected at random, all had disruptive flooding events within the past year). Even considering extreme events known more for their wind and waves coastal flooding causes the majority of the damage. A study of port cities focusing on sea-level rise and storm surges found about 39 million people worldwide live at elevations with an approximately 1% annual risk of being flooded, increasing to 150 million by 2075, and ballooning into the middle triple digits if more-minor events, like basement and street flooding, are included in the tally. Using estimates from that study and another of future population and asset growth in flood zones, as well as of the future flood zones themselves, the value of global assets exposed to 100-year flooding in 2100 will be approximately 10% of global GDP — in other words, sea-level rise alone will exert an annual drag on global GDP on the order of 0.1% even with significant assumed investment in flood protection. This is an enormous sum in comparison with landmark disasters like Hurricane Katrina which caused about USD$100 billion in damages. (See figure below, where the largest values in individual urban areas are several trillion USD.) And this drag will of course not be spread out evenly around the globe but will be concentrated in those cities, many of which (such as Kolkata and Dhaka) are struggling to provide basic services even in the absence of this extra burden. Yet surely people will continue to pour into them, making the rational decision that, having next to nothing, a chance for upward economic mobility is worth the tradeoff of a still comparatively small risk of serious flooding. As economists know but scientists sometimes forget, people can know the environmental risks but still consciously take them in pursuit of other goals. On the bright side, the large majority of coastal urban areas would be minuscule dots in the figure because they are elevated enough to remain mostly dry in ~100-year flooding events even after a sea-level rise of several feet (an example for New York City from Philip Orton). But it is dangerous to take this as comfort, because 1. these are only estimates and the full spread of possibilities is much wider (due to model and climate-feedback uncertainty) even given the warming we're locked into based on our GHG emissions so far; 2. in the next 100 years about half of the coastline will experience events more intense than the 100-year benchmark and we don't know which half that will be; and 3. failure to react to a small change means a large one becomes more likely. Flood prevention is also a high-stakes game in the sense that much of the damage occurs in the first 50 or 100 cm of flooding, as well as being spatially concentrated and subject to the whims of Nature's cruel coincidences. A more-optimistic view comes courtesy of the Netherlands, which having engineered and maintained a successful large-scale flood-protection system has the exigency of needing to continue to protect the 60% of their land that's below present-day sea level, but concomitantly the luxury of being able to plan further ahead and dream more wildly, since big dreams are what's required. If Homo sapiens can conduct extraterrestrial colonization, we are certainly capable of constructing floating cities here in the otherwise friendly confines of Earth. 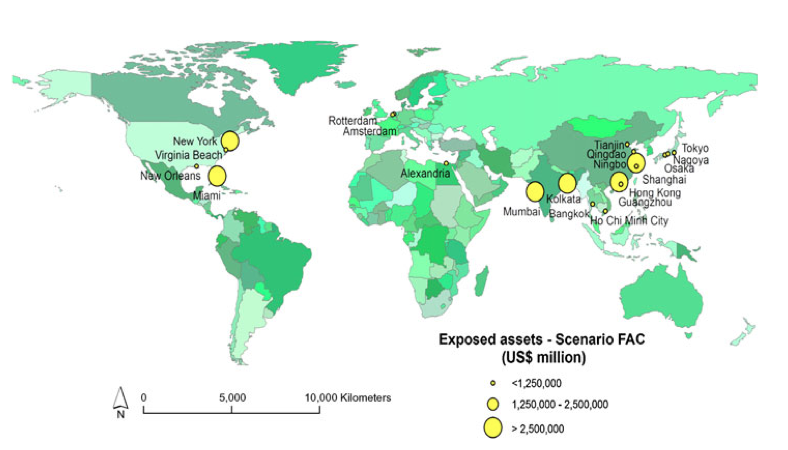 Value of assets exposed to 100-year flooding events as estimated for the 2070s, with the top 20 cities globally shown. Source: Hanson et al. 2011.
0 Comments
|
Archives
September 2023
Categories |
 RSS Feed