|
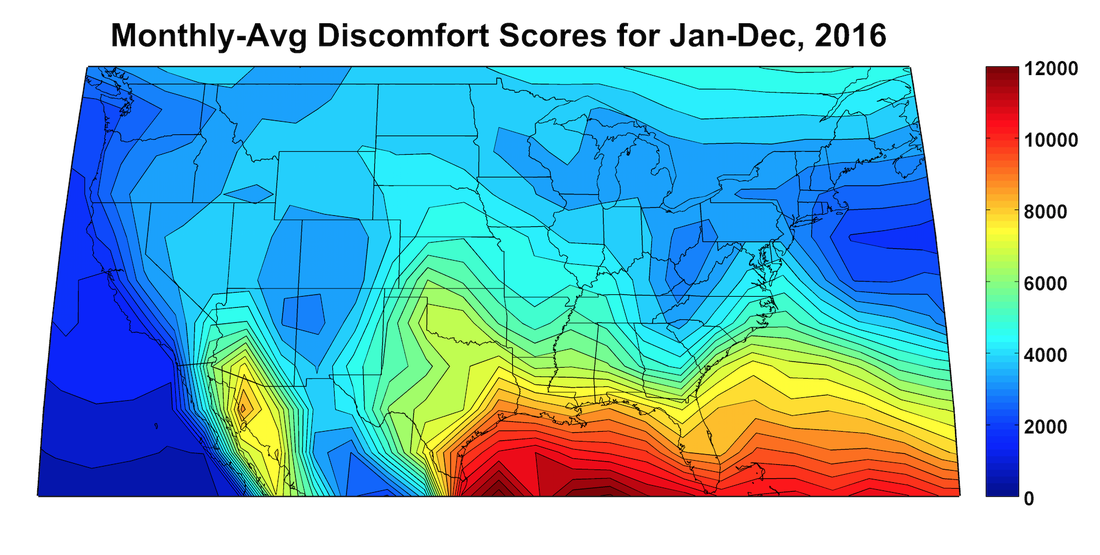
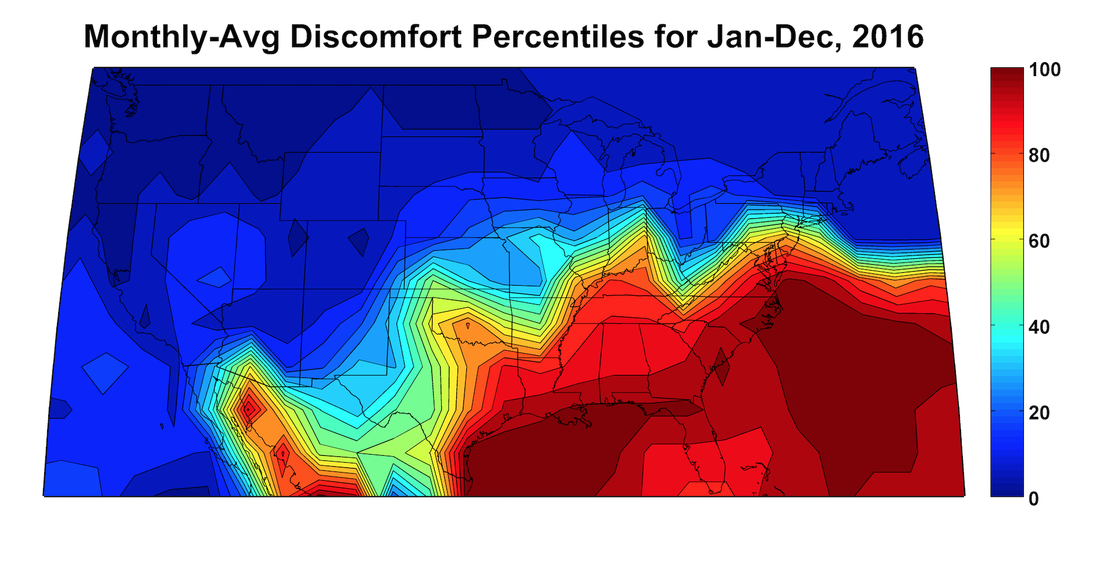
In this post I'll recap the full year 2016 in the continental US — as well as winter 2017 — using comfort scores, as a supplement to the many other high-quality summaries out there that use more-traditional metrics (i.e. average temperature). Essentially, I intend it to capture the perceived pleasantness of a given 6-hour period, with temperatures between 70 F and 80 F considered ideal, and temperatures below 70 F or above 80 F accumulating 'discomfort' points in accordance with their wind chill or heat index respectively. Points are apportioned so that, for example, a wind chill of 30 F is considered roughly equivalent in comfort to a heat index of 92 F. This definition is applied to NCEP reanalysis data to produce the below figures and calculations. Additional comfort-score maps are found over on the Recent Weather page. Averaged over the entire year (first figure below), it's clear that heat and humidity over the Gulf of Mexico combine to make it, and areas immediately adjacent to it, quite uncomfortable. In fact, due to high heat indices, these areas lead the country in discomfort three seasons of the year. With its lower moisture, despite high summer temperatures, most of the West is considerably more comfortable than the Southeast, with the sole exception of North-American-Monsoon-influenced southern Arizona. The entire Pacific coast, along with eastern New England, stand out as the most comfortable spots. In the northern tier of the country and into southern Canada, the annual-average discomfort is dominated by the winter months, and thus it increases going further north. In terms of individual cities, the most comfortable year-round are San Francisco (mild winters and cool summers) and Honolulu (cool winters and warm summers). The most uncomfortable are Brownsville, TX and Miami.  In the next figure, we can see the same data computed relative to the normal picture. This shows that 2016 was a warm year in nearly all of the country: the southern parts were less comfortable than normal (percentiles > 50), and the northern parts were more comfortable (percentiles < 50). Where the color scale maxes out in dark red — in the northern Gulf of Mexico and the western Atlantic — discomfort was record-high due to record high SSTs, whereas in the Pacific Northwest it was record-low, due mostly to a lack of cold wintertime temperatures in concurrence with the cloudiness and precipitation of the strong El Niño. Plots for winter 2017 can be found on the Recent Weather page. In winter, moisture is low enough that it doesn't really play a role in affecting comfort, and so comfort is a temperature-only story. Thus, as is typical, the most comfortable areas were Hawaii and Florida, and the least comfortable the Upper Midwest across to the inland Northwest (with anomalous warmth in the inland Northeast taking it out of this competition in which it is normally a contender). The Southeast and lower Midwest were much more comfortable than normal due to persistent anomalous warmth that has also resulted in those areas having phenological spring arrive several weeks early. In contrast to last year, cool conditions have dominated the Pacific Northwest and made it less comfortable than normal (the conclusion also reached by the Weather Channel after a parade of storms there).
As in 2016, a recap and discussion of the past winter in terms of snowfall (also tracked regularly on the Recent Weather page) will happen once the snow stops falling at the highest ski resorts, probably sometime in May. Regular blog posts will of course occur in the interim, so keep an eye out for those!
0 Comments
|
Archives
September 2023
Categories |

 RSS Feed