|
The notion of 'long-term means' is fundamental to climate science. Averaging over time and/or space constitutes the very definition of climate, according to authoritative sources such as the WMO. It's baked into our sense of the world as humans -- that if we wait long enough, all reasonably likely things will occur, and as a corollary, our memories and lived experiences are good proxies for the probability of occurrence of certain events, and the range of possibilities. But in times of rapid change, this sense (which goes by the technical term 'stationarity') can be undermined, and with it associated ideas such as anomalies. The question then becomes, if each decade is different in a statistical sense than the decades on either side of it, how are we to conceptualize the climate system -- as crystallized in, for example, major decisions about where to live, where to make investments, or whether to buy certain kinds of insurance (and how much). Recent evidence points to an approximately 5-year window over which people tend to adjust to climate regimes, which creates some cause for concern that rapid climate change will not be perceived as such, and we will not fully appreciate the environmental damage that it creates. Although there is clearly inherent tension between physical and psychological realities and the usage of 'averages', there is no good answer for many of these issues, which is likely why 'averages' and their ilk continue to be regularly cited and discussed in many contexts. (The nomenclature of 'climate normal', as used by the National Weather Service and others, is particularly prone to misinterpretation.) An especially striking case in point involves the most recent set of Climate Prediction Center seasonal outlooks. For three-month-average periods going out 15 months, each part of the country is shaded according to whether above-average, near-average, or below-average temperatures are expected, and also the confidence of these predictions. Remarkably, throughout the entire period (out to boreal autumn 2020), every part of the country is expected to see near- or above-average conditions, with above-average accounting for the vast majority of that. These categories are based on a tripartite splitting of the 1981-2010 temperature distribution, which made me curious as to how the probabilities may have shifted in the 20-25 years since the midpoint of that time period. I used the difference between the 2013-2017 and 1981-2010 season-average CPC temperature data as a rough approximation of recent seasonal warming, and added this value to the 1981-2010 33rd percentile, to see just where what used to be a 33rd-percentile day now falls. Since seasonal averages vary fairly little from year to year, a large percentile change can result from a modest mean warming -- and this is what I find in the below figure. Over much of the country, 20 years of warming have turned what was a 33rd-percentile day into one in the warm half of the 'normal' distribution, and up to the 75th percentile of 'normal' in the most rapidly warming regions and seasons. In other words, a '75' on the map indicates the bottom 75% of the 'normal' distribution now occurs only 33% of the time. I've made a small spreadsheet illustration of this shift, which appears below the map. Clearly 5 years is much too short to make any kind of reliable climate statement; perhaps the next 5 years will bring something a bit different. But the purpose of this analysis is more of a proof of concept, of how much 'normals' are being eroded by ongoing rapid warming, and that the lack of 'below-normal' conditions projected over the entire continental U.S. for the entire next year is not nearly as improbable as it might at first seem. 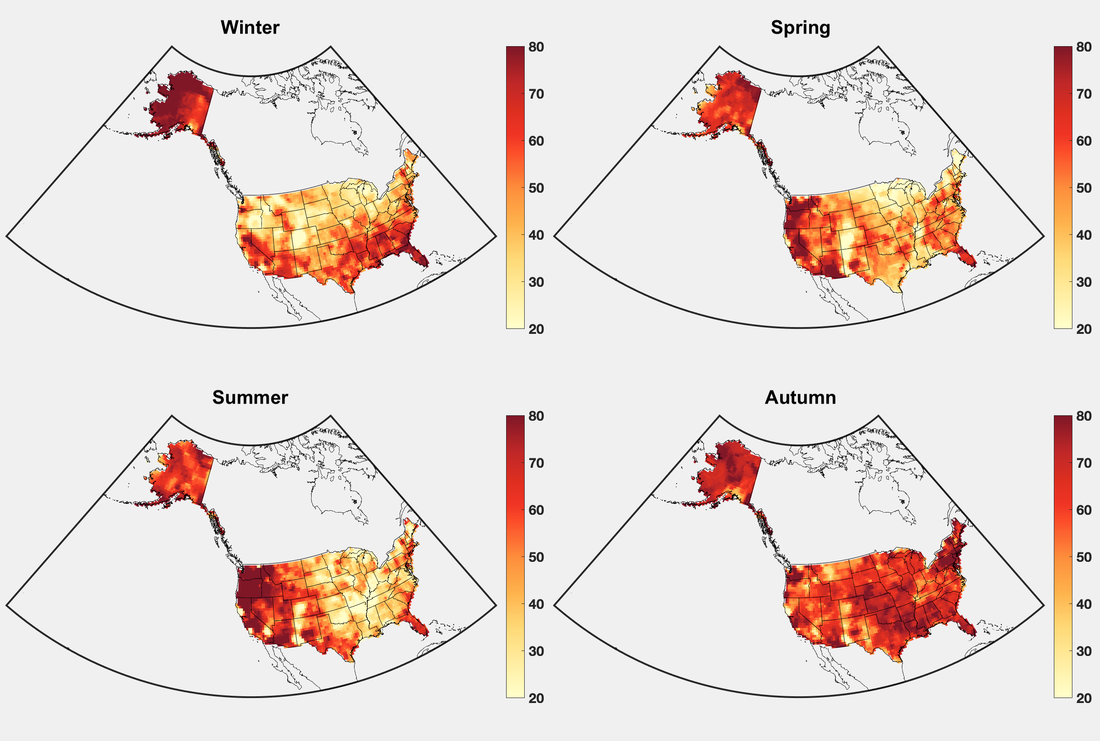 The percentile where a 1981-2010 33rd-percentile day now falls within that distribution, due solely to seasonal and regional mean warming between 1995 and 2015. Any value above 33% indicates warming over the period. Data are from CPC, at 0.5x0.5 resolution. 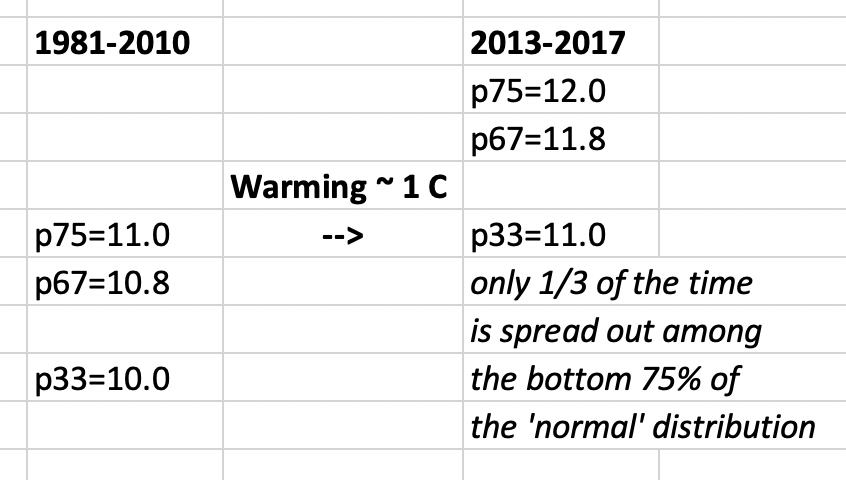 A synthetic example providing a back-of-envelope illustration of the statistical effect underlying the rapid percentile changes (relative to the 'normal' temperature distribution) that are shown above.
0 Comments
|
Archives
September 2023
Categories |
 RSS Feed