|
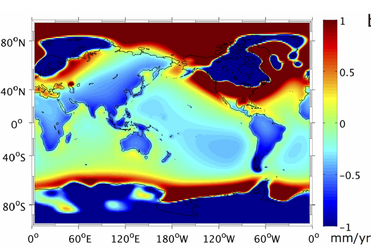
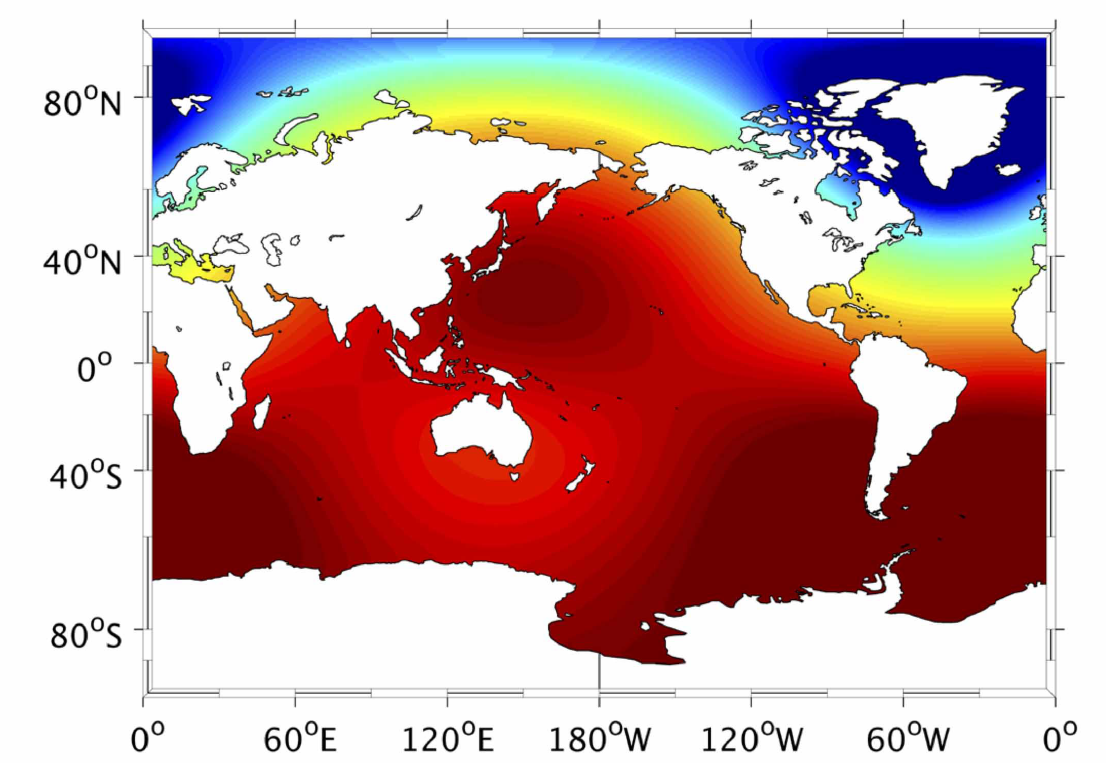
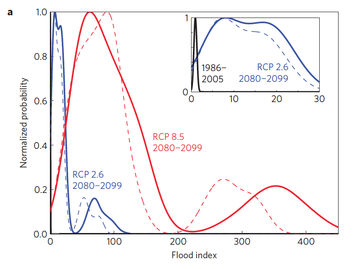
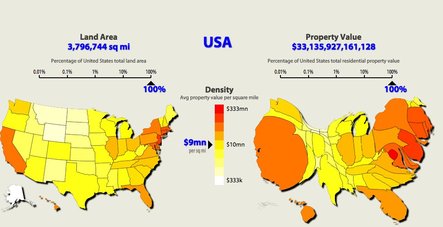
Note: this text was written for the website of the Consortium for Climate Risk in the Urban Northeast, where it will also be published by and by. The subject matter complements nicely many of the previous posts on this site, in the general sense of linking climate and social topics and particularly in exposing their deep interconnectedness. Global sea level is trending inexorably upward, and at an increasing rate (Figure 1). This acceleration is expected to continue over the course of the 21st century, though with wide uncertainty (Figure 2) — an uncertainty proportionally much wider than that for global-average temperature, on which it’s loosely dependent. In this post we explore some of the reasons for the large uncertainty in projected sea-level rise [SLR], and CCRUN’s contribution to the scientific effort aimed at understanding and whittling away at it. 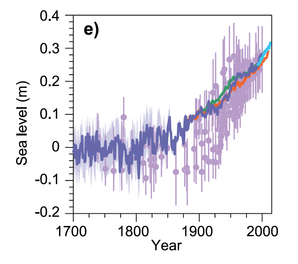 Figure 1: Increase in global-average sea level since 1700, estimated from salt marshes across the world (light purple), various tide gauges (dark purple, green, and orange), and satellite altimetry (light blue). These sea-level changes are calculated with respect to the geoid, i.e. local effects of uplift and glacial isostatic adjustment have been corrected for so the time series can be meaningfully compared across regions. Source: Church et al. 2013. 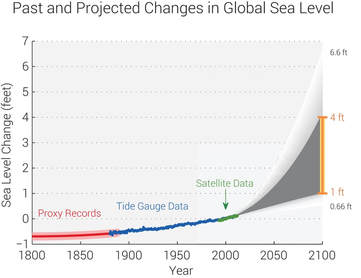 Figure 2: A timeseries of estimated global-average sea level, encompassing projections with a central range (dark gray shading) and wider uncertainty bounds (light gray shading) as well as a simplified time series starting in the year 1800. Source: Melillo et al. 2014 and Parris et al. 2012, via the National Centers for Environmental Information web portal (https://statesummaries.ncics.org/ny). There are three primary contributors to SLR: ice melting, thermal expansion, and changes in land height. The first two are mostly global in nature, whereas the last depends on local geological forces. Global-average sea level is rising about 3-4 mm/yr, and the majority of this is due to thermal expansion — as water gets warmer, it gets less dense, i.e. the same mass takes up more space. Increases in ocean volume due to melting ice account for another 1 mm/yr or so. In CCRUN’s focus area of the Northeast US, additional local SLR of about 1 mm/yr is attributable to the continuing readjustment of the land to the freeing of the burden that the North American ice sheet imposed on it until about 15,000 years ago (Figure 3). This “glacial isostatic adjustment” means that Canada and the northernmost tier of the United States are rebounding, while areas on the periphery of the glacier, such as most of the US East Coast, are compensating by sinking. And the ice-weighting effect is not trivial: bedrock under the Antarctic Ice Sheet is currently depressed 500-1000 m by the weight of the ice (Anderson 1999). Like a bathtub being warped, this results in apparent sea-level changes independent of increases in the total volume of the oceans. So what does the future hold? We know for certain that thermal expansion will continue apace, considering that it takes at least 1000 years for the ocean to come into thermal equilibrium with the atmosphere (Goodwin et al. 2015) – in other words, if we stopped emitting greenhouse gases today, the ocean would keep heating up for centuries. ocean volume will undoubtedly continue increasing in a warmer world -- but how much? The question is a thorny one because it’s not only the amount of melted ice that will determine future SLR, but the source: ice sheets are massive enough to have an appreciable gravitational effect on the oceans, so taking them away means a decrease in sea level nearby. Currently, Greenland is contributing somewhat more to SLR than Antarctica (Velicogna et al. 2014). As a consequence, North Atlantic SLR is slower than the global average (Figure 4). Projections that Greenland will continue to rapidly melt mean this regional dynamic could persist, so long as there are no big surprises from West Antarctica. Another Greenland-related factor also contributes to the Northeast US being a global hotspot of SLR uncertainty: the effect of its melting on the Atlantic Meridional Overturning Circulation (Little et al. 2015b). A slowdown in AMOC, resulting for example from a meltwater pulse, would tend to increase sea level in the North Atlantic (Goddard et al. 2015). Another significant dynamical factor is the North Atlantic Oscillation, which in its positive phase has southwesterly winds along the Northeast coast and consequent marginally lower sea level – any long-term changes in the NAO could thus have an impact on the local average rate of SLR as well. However, these regional variations pale in comparison to the potential global increases stemming from Antarctic melting. The total amount of ice on Earth is enough to raise sea level about 80 m, with East Antarctica accounting for about 65 m of this. Most research suggests East Antarctica will experience little melting as far as we can predict, and that West Antarctica and Greenland will retain ice for at least several hundred years. But these are suggestions rather than guarantees. While our species and many others have proven on the whole able to adapt to the continental-scale changes in coast locations, vegetation, and temperatures associated with glacial-interglacial cycles (Grant et al. 2014), these last occurred when humans were few in number, nomadic, and nearly possessionless, rather than having $1.5 trillion in immobile housing investments on the glacial moraine of Long Island alone (U.S. Census Bureau 2016). With all these social, ecological, and economic motivations in mind, CCRUN-affiliated scientists are working to estimate SLR on varying timescales. Radley Horton helped develop a model to predict the likelihood that a given coastal area will likely be able to adapt (by ecologic, depositional, or anthropogenic means) to seas as they rise, or whether the coastal ecosystem will simply become submerged (Lentz et al. 2016). For example, for a variety of reasons a marsh accrete sediment and remain marshy, or may “fall behind” SLR and disappear under the waves. The authors found that some locations are much more dynamic than others, allowing them more leeway to effectively maintain their ecosystem status quo (e.g. actively depositional barrier islands and beaches), whereas those that are more passive (e.g. marshes and impermeable surfaces) are most likely to be inundated (Figure 5). With relatively modest amounts of SLR, it’s presumed there will be successful anthropogenic efforts to keep most developed areas dry. 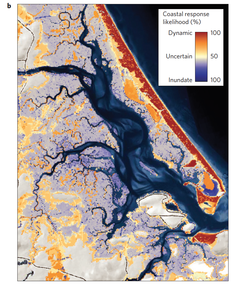 Figure 5: Predicted effect of sea-level rise on the coastline of Plum Island, MA, including the coast’s feedback response, in the 2080s relative to the present-day. Red areas are most likely to be functionally the same, while dark blue areas are currently above mean sea level but are likely to be flooded in the future. Source: Lentz et al. 2016. The Lentz et al. study, however, did not take into account the possible effect of stronger storms lashing the beaches and eroding away any progress they might have made in keeping pace with SLR. However, two earlier CCRUN papers did just that (Horton et al. 2015; Little et al. 2015b). As it turns out, SLR and tropical-cyclone intensity are highly correlated in climate models, and including this correlation results in a longer tail of future flooding extremes than would otherwise be predicted (Figure 6). A large fraction of this correlation can be attributed to the underlying factor of upper-ocean warming. While tropical cyclones are more powerful, “Nor’easters” occur more frequently and often move more slowly, increasing their overall flooding potential (Horton et al. 2015). Many storm-specific factors affect the location and extent of flooding from a given storm, including wind speed, wind direction, storm speed, storm direction (i.e. a storm coming from the east will pile up more water on an eastward-facing coast), precipitation intensity, total precipitation, and storm timing relative to the daily and bimonthly tidal cycles. Because coastal inundation is a function of storm flooding overlaid on mean SLR, long-term changes in any combination of these factors can ‘stack the deck’ in terms of exacerbating or counterbalancing the effects of mean SLR. Recent trends have been upward for both frequency and intensity in recent decades, with the majority of evidence suggesting the strongest storms will get even stronger (Horton and Liu 2014). CCRUN researchers are looking not just at the regional scale — using regional and global climate models, and leveraging correlations and other statistical tools — but at the level of the individual street. In this vein, a new nested model was designed specifically for New York Harbor (Blumberg et al. 2015). This enables questions to be answered about the very local impact of a given storm, sediment-dredging project, etc., and thus to make recommendations as to the most cost-effective measures to dampen waves and storm surges along complex coastlines. Such models are critical tools for assessing the local impact of a regional or global trigger such as accelerated ice-sheet melting. As one might expect from the highly varied times of tides even within a single short stretch of coastline, near-shore dynamics are inordinately complex and can result in feedbacks both positive and negative stemming from an initial perturbation. This is doubly true where humans have so highly modified the coastline, as in the Northeast US. Lack of awareness of this kind of nonlinear response was part of the reason for the unexpected severity of the flooding during Hurricane Katrina in New Orleans after some of the levees broke. In any system that evolves dynamically, projections inherently get more uncertain further and further out into the future. In the case of SLR, there’s not only the atmosphere, ocean, and cryosphere changes to consider, but also the iterative human response to these changes. And in addition to the mean, storm surges, storm tides, and large waves are additional complicating factors. While the 90th-percentile estimate of SLR by 2100 in New York City is about 75” (Horton et al. 2015), the analogy with insurance purchased in case of a devastating but rare event should be kept in sight. And this is particularly so for a region where finance and insurance have long been a pillar of economic success, alongside maritime industries like shipping and whaling, and where property values are among the highest in the country (Figure 7). To extend the finance analogy, in stocks the volatility index reflects investor sentiment about upcoming uncertainty in the markets. If such an index existed for the climate, it would surely be increasing, due largely to anthropogenic influences which are making it harder to predict the future even as understanding of the climate per se continues to get better and better. The most common investor response to expectations of high volatility is to pull out and wait for conditions to improve, but the Earth is a market that can’t be pulled out of, and that won’t recover naturally from an unnatural forcing. Thus CCRUN’s philosophy is to face such problems and their uncertainty head-on, with all the tools and information that can be mustered. Understanding issues of this magnitude, whether climatic or otherwise, is always a strong value proposition. References:
Anderson, J., (1999), Antarctic marine geology. Cambridge University Press, ISBN 0-521-59317-4. Blumberg, A. F., N. Georgas, L. Yin, T. O. Herrington, and P. M. Orton (2015), Street-scale modeling of storm surge inundation along the New Jersey Hudson River waterfront. J. Atmos. Ocean. Tech., 32, 1486-1497, doi:10.1175/jtech-d-14-00213.1. Church, J. A., et al. (2013), Sea-level change. In: Climate Change 2013: The Physical Science Basis. Contribution of Working Group I to the Fifth Assessment Report of the Intergovernmental Panel on Climate Change. Cambridge University Press. Goddard, P. B., J. Yin, S. M. Griffies, and S. Zhang (2015), An extreme event of sea-level rise along the Northeast coast of North America in 2009-10. N. Commun., 6:6346, doi:10.1038/ncomms7346. Goodwin, P., R. G. Williams, and A. Ridgwell (2015), Sensitivity of climate to cumulative carbon emissions due to compensation of ocean heat and carbon uptake. Nat. Geosci., 8, 29-34, doi:10.1038/ngeo2304. Grant, K. M., et al. (2014), Sea-level variability over five glacial cycles. Nat. Commun., 5 (5076), doi:10.1038/ncomms6076. Hay, C. C., E. Morrow, R. E. Kopp, and J. X. Mitrovica (2015), Probabilistic reanalysis of twentieth-century sea-level rise. Nature, 517, 481-492, doi:10.1038/nature14093. Horton, R. M., and J. Liu (2014), Beyond Hurricane Sandy: What might the future hold for tropical cyclones in the North Atlantic? J. Extr. Even. 01, 1450007, 30 pp., doi:10.1142/s2345737614500079. Horton, R. M., C. Little, V. Gornitz, D. Bader, and M. Oppenheimer (2015), New York City Panel on Climate Change 2015 Report Chapter 2: Sea-Level Rise and Coastal Storms. Ann. N.Y. Acad. Sci., 1336, 36-44, doi:10.1111/nyas.12593. Lentz, E. E., E. R. Thieler, N. G. Plant, S. R. Stippa, R. M. Horton, and D. B. Gesch (2016), Evaluation of dynamic coastal response to sea-level rise modifies inundation likelihood. Nat. Clim. Change, 6, 696-701, doi:10.1038/nclimate2957. Little, C. M., R. M. Horton, R. E. Kopp, M. Oppenheimer, G. A. Vecchi, and G. Villarini (2015), Joint projections of US East Coast sea level and storm surge. Nat. Clim. Change, 5, 1114-1121, doi:10.1038/nclimate2801. Little, C. M., R. M. Horton, R. E. Kopp, M. Oppenheimer, and S. Yip (2015), Uncertainty in twenty-first-century CMIP5 sea-level projections. J. Clim., 28, 838-852, doi:10.1175/jcli-d-14-00453.1. Melillo, J. M., T. C. Richmond, and G. W. Yohe, Eds. (2014), Climate change impacts in the United States: The Third National Climate Assessment. U.S. Global Change Research Program, 841 pp., doi: 10.7930/J0Z31WJ2. Parris, A., P. Bromirski, V. Burkett, D. Cayan, M. Culver, J. Hall, R. Horton, K. Knutti, R. Moss, J. Obeysekera, A. Sallenger, and J. Weiss (2012), Global Sea-Level-Rise Scenarios for the US National Climate Assessment. NOAA Tech Memo OAR CPO-1. 37 pp. Spiser, M. (2015), Resizing America based on property values. Business Insider. http://www.businessinsider.com/resizing-america-based-on-property-values-2015-7. U.S. Census Bureau (2016), 2011-2015 American Community Survey 5-Year Estimates. https://factfinder.census.gov/faces/tableservices/jsf/pages/productview.xhtml?src=CF. Velicogna, I., T. C. Sutterley, and M. R. van den Broeke (2014), Regional acceleration in ice mass loss from Greenland and Antarctica using GRACE time-variable gravity data. J. Geophys. Res. Space Physics, 41, 8130-8137, doi:10.1002/2014gl061052.
0 Comments
|
Archives
September 2023
Categories |

 RSS Feed