|
Reading by the pool? Underrated. Really, the end of summer is an opportune time for looking at recent heat events in a longer-term context, and thinking about what can be learned from using their differences as a window into the broader categorizations of heat waves. 2015, like 2014 before it, is on track to nominally be the overall warmest year in the observational record (due to incomplete spatial sampling, adjustment uncertainties for urbanization and elevation, etc, this can never be completely certain, so several other years have a nonzero probability of actually having been the warmest, all of them since 1998; in other words, of all the years since 1880, 2014 wins first place by a plurality). Of course, as can be seen in the map at the first link, there is always large spatial variability around the globe, so not everyone feels this warmth firsthand; indeed, it does not rule out 2015 being the coldest year at certain sites (chart is for Ithaca, NY, with the black line representing 2015 through Aug 28). But it does, naturally, predispose a greater severity (intensity+duration) of heat waves overall. A recent paper examined this truism with several models to see how projected warming would affect the severity of heat waves over the course of the 21st century in regions that have recently experienced record-setting heat events. One figure from that paper is shown below: using a custom-defined "heat-wave magnitude index" that is essentially the sum of consecutive hot maximum temperatures, a few K of mean warming translate to heat waves every year in the late 21st century much more severe than any observed up to this point. Many other studies using different definitions and models have come to similar conclusions. Some notes of caution are due, however. There are general irreducible uncertainties about the models -- though in this case, with averaging over large regions, these standard (CMIP5) models hew closely to observations when tested over the historical period. There are synoptic kinds of uncertainty, such as whether blocking (stalled pressure systems) turns out to behave somehow differently under similar governing conditions than it does at present. And there is the question of the representativeness of this particular heat-wave magnitude index for human-health impacts and ecosystem vulnerability. Minimum temperature has generally been found more important than the maximum, for instance, and impacts are always a combination of duration, intensity, and frequency in unknown proportion, all interacting with cultural and physiological factors. Interestingly, there has also been some indication that acclimatization on multi-year timescales has already occurred in France (in addition to the perennial seasonal kind discussed in an earlier post), suggesting that this may help to pull down the impacts from the ballooning predicted severity of future heat waves. 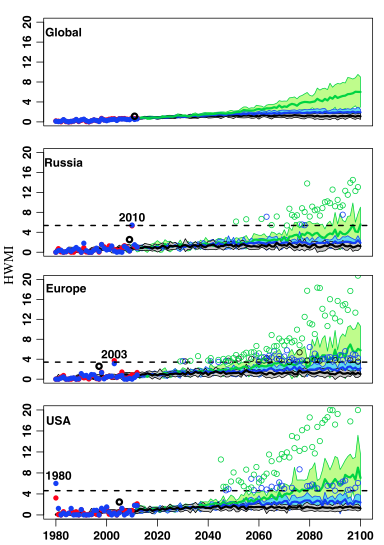 Projections for a maximum-temperature-defined "heat-wave magnitude index" over the globe and in several regions with well-studied record-setting events that were large, intense, and long. Red and blue in the observational record indicate different datasets; green, light blue, and gray in the future indicate the RCP 8.5, 4.5, and 2.6 climate-change scenarios. Source: Russo et al. 2014. So what were the major stories of the summer, heat-wise? A blog post by Jeff Masters summarizing the events to date as of July 1 already had a lot to talk about. The India/Pakistan heat wave probably received the most attention, particularly centered around the death toll in Karachi, with similar stories from India as well (though less exacerbated there by the water-forgoing strictures of Ramadan). High temperatures but minus the large cost in lives continued to be observed in parts of western Europe in July and August, with July temperatures in Geneva rivaling those of the infamous August 2003 heat wave. Perhaps most memorably, the Iranian city of Bandar Mahshahr on the Persian Gulf saw its heat index (the version as defined by the National Weather Service) soar to 165 F/74 C, pushed along by an exceptionally high dew point of 90 F/32 C (for a modest-sounding relative humidity of 47%). A Weather Channel graphic from that evening is shown below. These conditions aren't even on the NWS heat-index chart; after all, temperatures almost always can only get that high with relative humidities below 20% (witness Baghdad in the figure) -- because with more moisture in the air, solar heat input goes more to heating water vapor than to raising the temperature. Whether or not the standard formulation of this heat index is a reasonable representation of the physiological stress under those exceptional conditions is debatable (it's not valid under 80 F either, and there were no reports of mass casualties); nevertheless, a purely maximum-temperature-oriented approach would not capture the surely suffocating experience of 115-dewpoint-of-90. These kinds of humid extremes are poorly understood but clearly result from a rare degree of interaction between hot air from the inland deserts and moist air from the Persian Gulf along a coastal strip. In Dhahran, eastern Saudi Arabia, location of a world-record 95 F dewpoint in 2003, summertime maximum temperatures have increased over the last few decades, as have minimum temperatures, although the changes are spatially variable within the Arabian Peninsula. Dewpoint temperatures have modestly decreased (but sharply increased just to the south; see Fig. 15 in last link). Trends contributing to humid extremes: inconclusive. 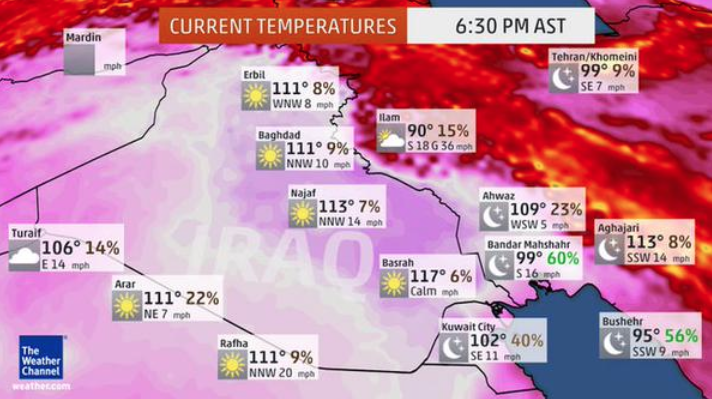 Weather Channel graphic from the evening of Jul 30, showing the combination of residually high temperatures with a band of exceptionally humid air along the immediate Persian Gulf coast. Overall, summer 2015 did see an abnormally high intensity and spatial coverage of extreme heat relative to the observational record, though on longer timescales we can only say probabilistically that with lower mean temperatures in the past we expect there to have been fewer and/or less-severe heat waves. Don't even try to look for trends in extreme heat indices -- there are too many definitions and too few data to come anywhere near a clear conception of that. And for impacts, it is surely not the case that Europe 2003 and Russia 2010 actually stood out as the deadliest, or even deserve a spot on the all-time top 10; like with temperatures themselves, changes in definitions, preparedness, and awareness dominate over the environmental conditions. The more angles we look at heat waves from the fuzzier our simple mental conception of 'high temperatures' gets, but conversely the more accurate it becomes.
0 Comments
As climate has moved more and more into the consciousness of the people and organizations who make political, investment, and development decisions that affect all of society, the vocabulary used to describe the various ways in which such decisions engage with climate or climate projections has increased commensurately. We now have 'impacts' on 'stakeholders' which we address with 'adaptation', 'mitigation', and 'resilience', but also with broader measures of 'sustainability' and reductions in 'vulnerability'. Even as someone who encounters these terms every day, I realized I might be hard-pressed to give an exact definition of them, much less to give a coherent explanation of why in a particular circumstance one would be preferable to another. Only once the terms are all on solid linguistic ground can the ultimate and inherently local question be taken up of when one type of reaction is preferable to another, given a suite of social, economic, and cultural factors. The first of these terms is so common that I placed it in the title of this post without even noticing. The IPCC glossary defines impacts as "the effects of climate change on natural and human systems"; this is a fine definition for an organization that has the CC of climate change right in its name, but from a broader perspective natural climate variability (e.g. ENSO) should be included as well. After all it's the superposition of anthropogenic and natural climate forcings that will determine the future climate that planners must account for. 'Stakeholder' is similarly vaguely defined in terms of one's potential to be affected 'by an entity' -- in this case, the entity being the future climate in the region of the stakeholder's interest. In policy parlance 'stakeholders' and 'decision makers' tend to be strongly overlapping sets; in a typical region they might consist of various municipal-government departments, utilities, corporations, community boards, and the like. The concerns of individual households are assumed to be covered by this array of larger organizations, making it crucial that a wide variety of stakeholders are included in selecting research topics and deliberating on actions -- but not too wide, lest research efforts be spread too thin. This tradeoff follows the precepts of Arrow's impossibility theorem, where having fewer moving parts in a decision-making machine is often desirable despite thus less precisely matching the full distribution of societal preferences.
'Sustainability' is an overloaded station wagon of a word that even in the specific urban-climate context can take on a number of different meanings. Most broadly, it is used to refer to any system or action that reduces the consumption of some natural resource (energy, land, water, materials, etc) and by consequence the ecological footprint of the population. A full evaluation of it would require each person tracing back the resources consumed in the production of every commodity they use, wherever they came from and whatever steps were taken to get them into their final forms. It's typically the reduction in the resources that matters, as it's impossible to say exactly what can be sustained per se, and over what time period the accounting is done. When the flux of resources through our lives is reduced, we say that we are less vulnerable, meaning less susceptible to disruptions. This is a particularly salient point for urban residents the world over whose food, energy, clothes, devices, etc must be shipped in every day, even a brief halt to the system causing weeks-long ripple effects. Vulnerability is often broken down into sensitivity (e.g. the percent chance that someone will suffer heatstroke at a certain temperature) multiplied by exposure (the number of exposures per time period); to obtain the societal impact, multiply again by the population affected. Technological advances and transitions away from agricultural occupations may well reduce global exposure to climate extremes despite increasing numbers of extreme events overall. In this solar system of vocabulary, where newly coined words hurtle around like asteroids, mitigation and adaptation are like the binary stars, at the center of most every conversation. Fittingly, neat definitions of the two are given on NASA's "Vital Signs of the Planet" website. In short, mitigation is mostly about greenhouse gases, while adaptation is about animals, plants, water, non-extreme temperatures, and all the other things that people need and climate affects. A decade or more ago mitigation was the preferred tack, via emissions cuts most prominently, but as the world has continued on a high-emissions pathway (see post "The Human Element: Time Dependence") adaptation has gone from being seen as a concession to something worth striving for -- indeed, that needs to be striven for in the continued absence of serious mitigation efforts. (Adaptation is sometimes rolled into the definition of vulnerability as well.) The talks in Paris this coming December will provide another chance for international reassessment of commitments to each vis-à-vis the other. Recently, talk has moved beyond adaptation to resilience, and specifically the sense of the word suggesting that failure in the face of uncertain and changing conditions is not in and of itself disastrous, and that good preparations that happen are better than great ones that don't. The nuances of resilience are nicely analyzed in this blog post. The term "graceful failure" encapsulates the essence of this new concept, wherein a certain percentage and/or magnitude of failures are deemed acceptable. On the other hand, with distributions of climate variables often being inherently long-tailed, the merits of such an approach are debatable. It only takes one very extreme event to make irrelevant a lot of well-laid plans, so a reasonable case could be made that the absolute worst-case scenario should be at least considered, insofar as is possible. The insurance industry uses statistical models run hundreds of thousands of times to get estimates of the extreme tails of the distribution of whatever variable (wildfires, floods, heat, etc) they are financially exposed to. The burden of this computation makes greater sense at longer time horizons, so it doesn't make sense in every circumstance, but generally speaking knowing the bounds with reasonable certainty is an important prerequisite of resilience, which in turn backstops more-mundane adaptation and mitigation measures so that stakeholders can reduce their vulnerability in the near term while also keeping an eye on climate impacts over much longer time horizons. |
Archives
September 2023
Categories |
 RSS Feed