|
Using the algorithm I developed that's described on the Recent Weather page (and which I applied to the United States in an earlier post), here I extend the analysis globally using a gridded reanalysis product (NCEP). This data is a combination of all available stations, standardized to remove known effects like urban heat islands, and is produced at 6-hourly intervals. The algorithm I'm using computes comfort as a function of the heat index (if hot) or the wind chill (if cold), with the ideal conditions defined as being between 70 and 80 F, 24 hours a day. Notably, precipitation is not included -- though it may be in future iterations.
Doing this computation for world metropolitan areas with more than 2.5 million people (first figure below; click at top left to select a month to view) reveals some clear patterns. First and foremost, cities in the tropics (i.e. with nearly constant temperatures) at moderate elevations (i.e. are cooler than sea level) are comfortable all year long. This makes many of the South American cities rank very favorably. Spring in East Asia is pleasant (it's still relatively cool in North America and Europe), with nice summers particularly in coastal West Africa, then East Asia and Italy make appearances in autumn. Boston (July and August) is the only US city on the list, keeping San Diego from the stage in those months. November and December are omitted due to map limits, but are similar to March and February respectively. I also calculated the least-comfortable cities, though I don't show the map here; given the lack of large cities in the cold parts of the Southern Hemisphere, this list is studded with cold cities in boreal winter (Russia, northern China, and Canada) and then from spring through fall flips to tropical cities experiencing their dry season (e.g. India, West Africa) alongside perennially hot and moist areas (Indonesia, Singapore).
Then, I was interested in the question: given a particular location, when's the best time to visit it, according to this algorithm? Below is a first stab at an answer. In the map, reds and purples represent areas that are most comfortable in boreal winter (December-January-February) and greens represent areas that are most comfortable in boreal summer (June-July-August). Broadly speaking, the patterns track the warmest month in cool climates and the coolest month in warm climates. Note that this means cool ocean areas track SSTs and show up as September or October in the Northern Hemisphere, but this is interestingly not the case in the Southern Hemisphere. I speculate this characteristic may be related to the significantly stronger wind speed in the SH resulting in lower wind chills over the ocean during boreal-autumn storms, even if the SSTs are warmest then.
Because the map is based on a 2.5x2.5-degree grid, fine spatial details are not resolved. Nonetheless, one can still pick out regional features like the warmth of the Northeast-US corridor relative to inland (October vs August/September); the cool post-monsoon climate of southwest India; the island of cooler air over the Alps; the month-by-month progress of clear latitudinal bands of comfort stretching across Australia; and the dryness of western China relative to eastern, which results in the former being most comfortable in mid-summer while the latter is so in mid-spring and mid-fall. The data being of better quality than that of Mieczkowski 1985, and the algorithm more precise, in my view these results are a refinement of his work, and yet agree well with his "tourism climatic index" for January. While humans are capable of adapting to any climate, this comfort analysis is designed to reflect the ease of living in a particular location, climatologically speaking. It thus also is an index of the amount of energy needed to maintain equable indoor temperatures -- a place like Saudi Arabia, where 60% of summertime energy consumption goes toward air conditioning, clearly does not rank high on this list. With more and more of us on the planet, and continual discussions of how to achieve energy savings, perhaps some movement to the tropical highlands is in order. And, if further impetus is needed, consider that this is also where most of the world's coffee is grown. 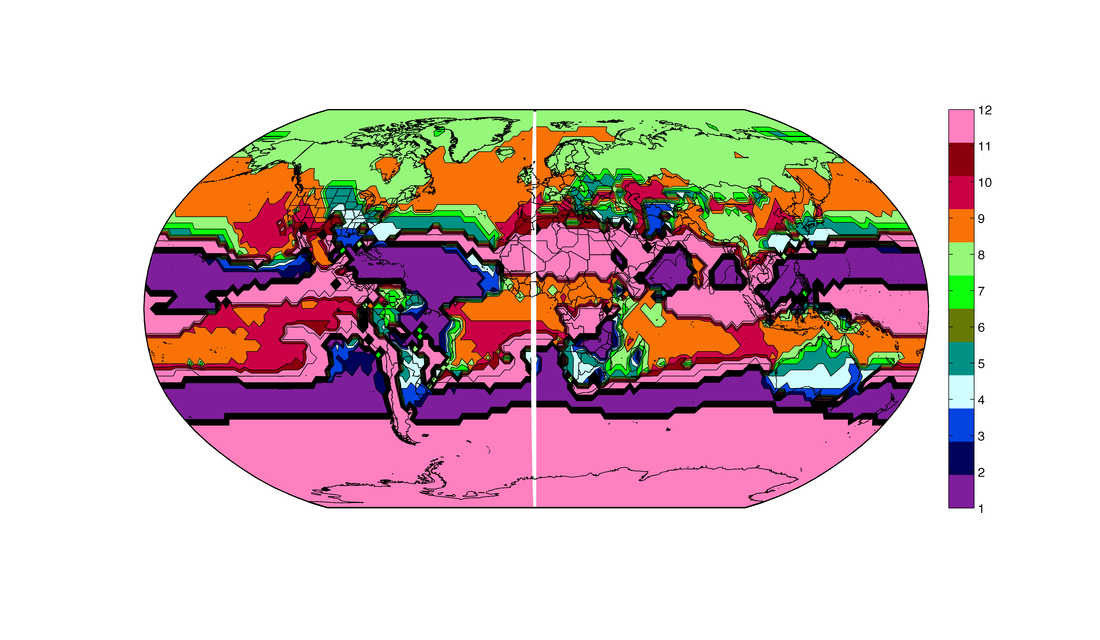
The most-comfortable month at each gridcell, with each color representing a month and ordered from January (bottom) to December (top). Values are calculated from NCEP reanalysis data for 1981-2016.
1 Comment
|
Archives
September 2023
Categories |
 RSS Feed