|
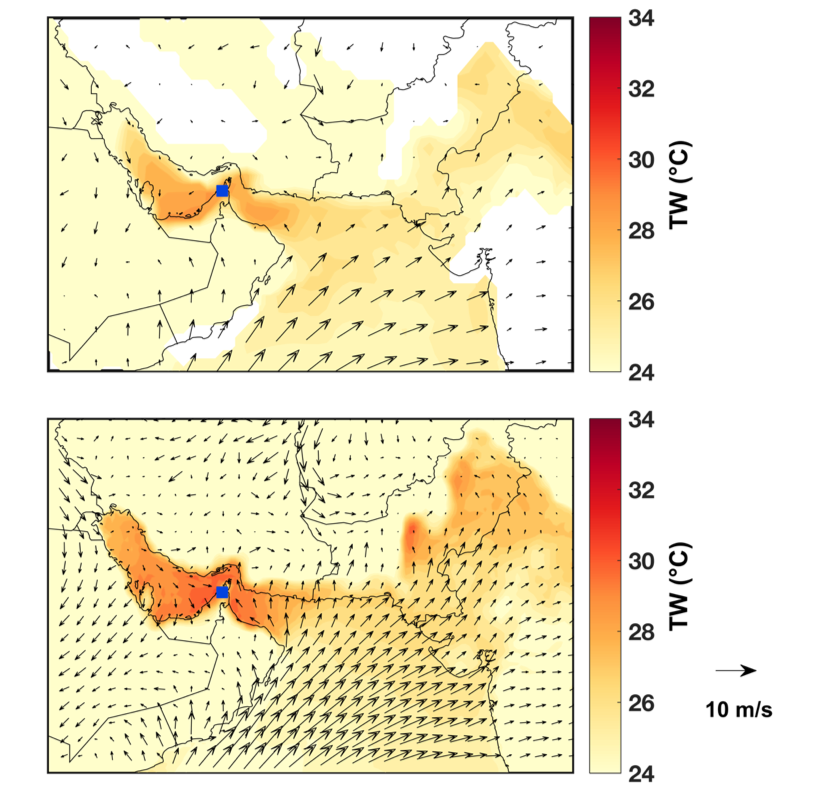
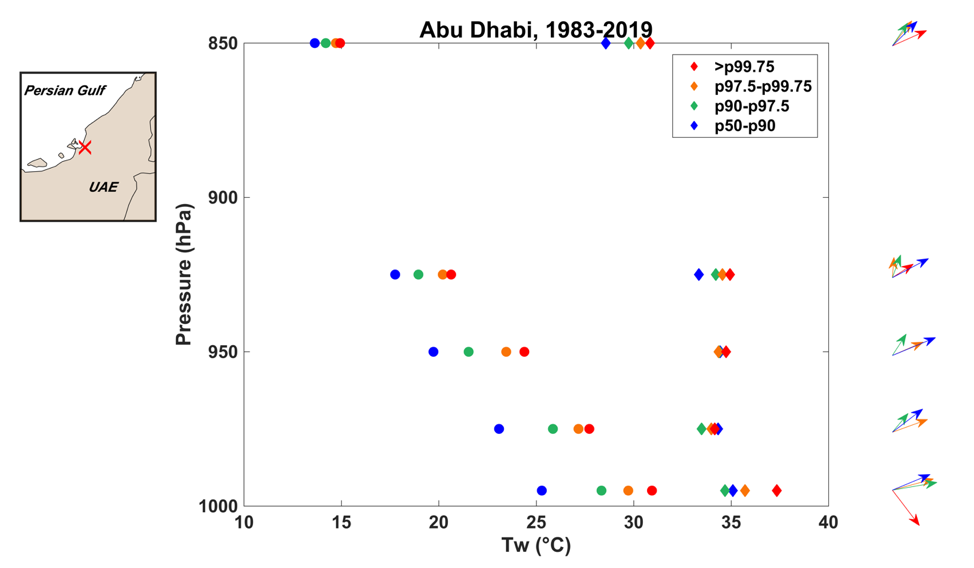
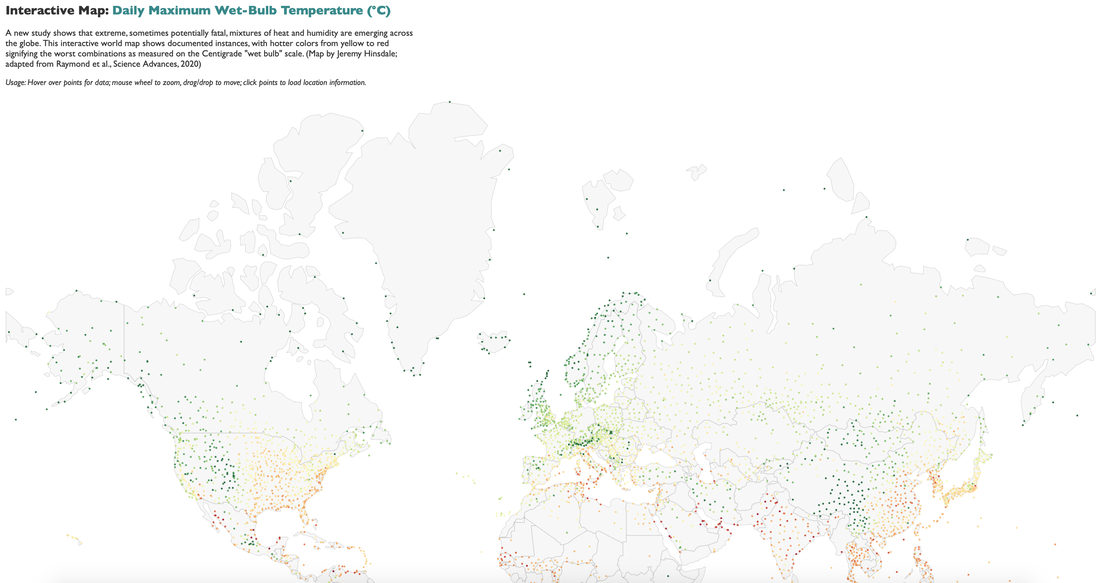
In the virtual pages of Science Advances today appears a study by Tom Matthews, Radley Horton, and me reporting advances in knowledge of the historical record of heat-humidity extremes. In this post I'll discuss some of the key findings, my thoughts about how they fit into the broader scientific context, and the kinds of future work that they help incentivize. The study is making some headlines probably because the concept of a wet-bulb temperature so high that it physiologically cannot be withstood for prolonged periods of time captures people's imaginations, but we have been careful to point out that the bulk of the work (as well as the novelty) rests in the story about values that are still extreme but decisively below this level. For instance, 33C corresponds to a temperature of 40C accompanied by a dewpoint temperature of 31C, and even 31C (which has occurred about 7,500 times globally over 40 years) exceeds the all-time maximum in the notoriously humid Washington, DC metropolitan area. These values preferentially occur in South Asia and select portions of Mexico, the Middle East, Australia, and East Asia. As published, in fact, the station dataset HadISD contains significantly more such extreme values (including dozens of exceedances of 35C), but we progressively eliminated many of these with additional quality-control measures ranging from temporal and spatial consistency checks (against the station itself, other stations, and reanalysis) to removing any dewpoint temperatures above the widely-reported 35C dewpoint recorded in Dhahran, Saudi Arabia in July 2003. We also dug deep into possible instrumental and observer errors. The result is what we consider to be a conservative estimate of global frequency and intensity -- keeping in mind that many of the stations record at 3- or 6-hourly intervals, rather than hourly, and also the paucity of good-quality observations in many global hotspots such as the Sahel; Iran and Pakistan; and East Africa. Every threshold value except for the exceedingly rare 35C has experienced at least a doubling in frequency since 1979, underscoring the tight and nonlinear relationship between global mean temperature and extreme heat. This creates an alarming prospect in a world where temperatures are rising rapidly. Expanding the reach of artificial cooling (in the form of air conditioning) serves as an obvious solution in the short term, but looking forward, the inevitability of further increases is a sobering reminder of the importance of both mitigation of the temperature rise, and adaptation to what's already in store. Architecture, urban & regional planning, and national policies around farming and land use could play important roles on the adaptation side, but need to be guided by highly region- and season-specific knowledge in order to be effective. For instance, in South Asia prior to the onset of the summer monsoon, wet-bulb extremes are driven primarily by excessive temperatures (~45C or higher), whereas afterwards they occur in conjunction with greater relative humidity but lower temperatures (more like 37C). This difference could lead to policies that prioritize reducing heat in spring, and reducing humidity in summer, while remaining cognizant of the many constraints on behavioral changes, such as the need of farmers to irrigate at specific times within the growing season.  Global trends in extreme humid heat. (A-D) Annual global counts of TW exceedances above the thresholds labeled on the respective panel, from HadISD (black, right axes, with units of station-days), and ERA-Interim grid points (gray, left axes, with units of grid-point-days). We consider only HadISD stations with at least 50% data availability over 1979-2017. Correlations between the series are annotated in the top left of each panel, and dotted lines highlight linear trends. (E) Annual global maximum TW in ERA-Interim. (F) The line plot shows global mean annual temperature anomalies (relative to 1850-1879) according to HadCRUT4, which we use to approximate each year's observed warming since pre-industrial; circles indicate HadISD station occurrences of TW exceeding 35°C, with radius linearly proportional to global annual count. This study does not so much increase our knowledge about the future as it does about the past. Specifically, it improves our understanding of the historical baseline and the details of the brief 'spikes' that it contains. While extremes of any variable are more intense when looking at small spatial and temporal scales, we were particularly surprised by the steepness of the horizontal and vertical gradients of wet-bulb temperature in places like the Persian Gulf and Gulf of California. During the most severe events, the dropoff as seen by radiosondes ascending from 995 to 975 mb (150 to 310 m) averages 5C or more! This is consistent with the expectation from the two powerful competing forces that shape extreme heat in these arid regions: a source of moisture, itself at high temperatures, sitting underneath a near-constant large-scale high-pressure system which acts to trap heat and moisture close to the surface. Under the right meteorological conditions (e.g. a continuous onshore flow, plus maybe some other anomalies which future work will need to establish), the sun beats down and moist static energy builds and builds in a shallow boundary layer with no means of escape. The small scales and brief times at which this occurs -- before being dissipated by some modest amount of horizontal or vertical mixing, for example -- make it very difficult for models or reanalyses to capture it with appropriate severity. ERA5 does a much better job than ERA-Interim, but the underestimates still generally exceed 2 deg C. Where the spatiotemporal scales of the extremes are larger, such as in the interior eastern United States, these reanalyses are right on the money.  Meteorological conditions when TW=35°C. (Top) ERA-Interim composite of 10-m winds and 2-m TW on the n=4 days when TW=35°C was recorded at Ras al-Khaimah, UAE (blue square). Resolution of plotted data is 0.5°x0.5° and 6-hourly. (Bottom) Same as top but for ERA5. Resolution of plotted data is 0.25°x0.25° and 1-hourly. Mean TW daily maximum near station location is 28.7°C for ERA-Interim and 30.8°C for ERA5.  Vertical profiles of coastal extreme humid heat. Radiosonde temperature (diamonds) and TW (circles) for Abu Dhabi International Airport, United Arab Emirates at 12Z on all days between 1983 and 2019 with a lowest-level TW value greater than the annual 99.75th percentile (red, 10 days); between the annual 97.5th and 99.75th percentiles (orange, 90 days); between the annual 90th and 97.5th percentiles (green, 298 days); and between the annual 50th and 90th percentiles (blue, 1593 days). Profiles are truncated at 850 hPa for visibility. Vectors on the right-hand side indicate composite wind speed and direction on these days for each height bin, where available; the map on the left-hand side is a 2.5x2.5 box indicating the location of the launch site. There remains much we do not know about the ingredients and impacts of these exceptionally rare events. How are they affected by irrigation or other land-cover change? By urbanization? By short-term variations in sea-surface temperature? By meteorological conditions such as monsoon progression or passing weather systems? Given the generally larger importance of humidity in producing the 'spikes' that we see, should more attention be focused on limiting extreme humidity rather than extreme temperature? Our paper hints at some hypotheses about these factors, but does not definitively establish or quantify them, especially in terms of how they may work together in varying combinations to affect extreme wet-bulb temperatures in one region versus another.
Ultimately, speaking for Radley and Tom as well as myself, we see our paper fitting neatly within the structure of the running conversation begun by hot-water-immersion tests in the early and mid 20th century, emerging definitively in the climate literature with Sherwood and Huber 2010, and continuing recently with papers by Pal and Eltahir, Im et al., and others. We hope that this robust conversation broadens and continues, evolving such that even as the leading edge of these extremes push beyond levels seen in the Holocene, human ingenuity and compassion find ways to forestall disasters in the near-term, and to develop policies and technologies in the medium- and long-term, that look holistically at this 'wicked' problem and chip away at the socioeconomic vulnerabilities, consumption habits, and development geographies that exacerbate it.
0 Comments
Leave a Reply. |
Archives
September 2023
Categories |

 RSS Feed