|
I recently attended the International Conference on Urban Climate, which, quite appropriately for an event whose major themes include megacities and hot weather, was held in New York during a typically grueling August heat wave. Among the ideas and findings were a number of demonstrations of emerging research tools. Some of them represent technological breakthroughs, others approaches applied in new and innovative ways. A selection of the most exciting are highlighted in the following paragraphs. As more and more money is poured into (re)designing urban areas in ways that are climate-aware, how do we ensure that this money is well-spent? For example, a common strategy is to plant more street trees, but how many and where? The usual approaches, in increasing order of accuracy and price, involve expert judgment; a few field experiments, extrapolated to the entire city; or a series of climate-model runs differing only in the surface land cover. A way to get accuracy much more easily is to employ an algorithm that can quickly run through possibilities and select the optimum. Kunihiko Fujiwara from Takenaka Corporation discussed just such an algorithm, aimed at designing an optimal Tree Arrangement Priority map for a city. This means iterating through the steps of tree arrangement, calculation of surrounding temperatures, determination of the cost-effectiveness of the tree, and finally back to slightly modifying the tree arrangement to see if the cost-effectiveness improves.
Tianzhen Hong from Lawrence Berkeley National Lab talked about his group's development of a new feature for the EnergyPlus software program which makes it possible to simulate energy demand of every building in a city at 10-minute intervals. To do this accurately, they must take into account its occupancy, materials, geometry, and neighbors, as well as the ambient weather conditions. The underlying platform, City Building Energy Saver, allows free analysis of neighborhoods in several US cities, both as they are and with potential modifications. This tool fills an important niche, as the interactions between adjoining buildings, neighborhoods, and even cities as a whole are drawing more attention (for example, a keynote by Marshall Shepherd discussed the nascent concept of ‘urban archipelagos’, a term implying that in some areas each island affects and is affected by the others nearby). 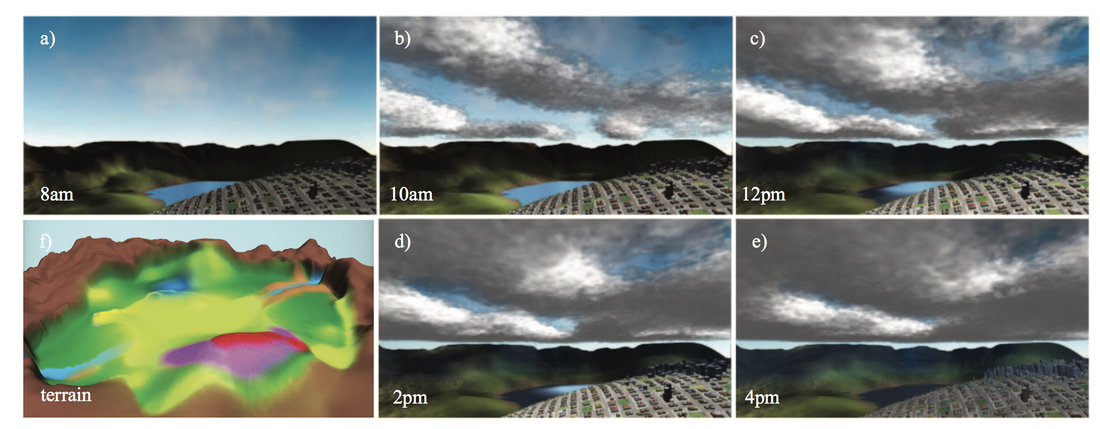 A 'digital synthetic city' with complex terrain and the output of a high-resolution weather model coupled to it. From Garcia-Dorado et al. (2017). Field campaigns are endangered. At least, that’s the sense I got from hearing several people discuss the Digital Synthetic Cities approach. A leading proponent of it is Dan Aliaga at Purdue, although it has more and more practitioners. The essential idea is to create a digital model of a city that has the same properties as a real one – the same building sizes and materials, the same thermal properties of the streets and vegetation, the same solar-radiation input – but which only exists in digital space, making it easier to study. The verisimilitude gives it a slightly uncanny movie-like or video-game-like quality, not too different from Seahaven Island in The Truman Show. Of course, creating synthetic data or a synthetic environment is nothing new, and is happening across disciplines. This speaks to the power and universality of statistics – at their core, statistics are exactly designed to serve as a layer of abstraction, to describe things such that the actual thing is no longer needed. The novelty is in the complexity and concomitant power of these digital synthetic cities to answer questions that were previously well beyond the range of feasible computation, such as understanding the causes of small-scale precipitation patterns in a particular storm. The advances this approach will bring include a newfound ability to examine details of a certain location's climate, but also to better generalize findings as new patterns are uncovered and new processes are simulated, making it easier than ever to not only say why Place A and Place B are different, but why they are similar.
0 Comments
Leave a Reply. |
Archives
September 2023
Categories |
 RSS Feed