|
This Halloween and election season follow right on the heels of some of the most dramatic weather-related challenges that the Western US has seen in a long time. Enormous fires burned major portions of the Pacific Northwest down through central California, including the coastal ranges, causing orange skies and historic air pollution in Portland and San Francisco, while Phoenix set a variety of extreme-heat records (that no one was cheering on) due in part to a nearly absent North American Monsoon. Drought has covered much of the West the last few months, also resulting in intense autumn fires in the Colorado mountains, despite a preceding and record-breaking early-September snowstorm. These weather extremes highlighted the slow climatic drivers that stress systems and, in combination with human-behavioral factors, can cause them to behave in intense or unexpected ways. Case in point: warming plus natural variability led to the extreme region-wide drought of 2012-16; the drought led vegetation to be weaker and more prone to beetle infestations; the combination of dryness and insects killed millions of trees; those trees provided ready kindling for any fires that sparked in the next dry year, either from lightning or human activities. That the Western-US landscape is dynamic and heavily shaped by human influence makes facing the constraints of the naturally dry (but strongly variable) climate a daunting psychological and political challenge. Having lived in California now for a bit over a year, my observation is that this state epitomizes how climate can serve as a revealing lens into the conflicted soul of a place. Below, I elaborate on this thought and what it means. 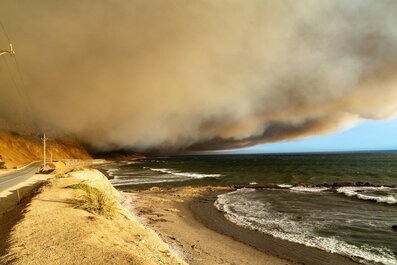 Smoke from the August Lightning Complex Fire in the Santa Cruz Mountains drifts over the Pacific Ocean in August. Source: Cal Fire. The statistics on California's success are everywhere: its economy is larger than that of France or India, and its companies shape the daily lives of billions of people. Yet despite its image as a paragon of a gentler sort of capitalism than is practiced in Texas or Florida, California encompasses gaping inequities: it is a land of dazzling success and glamour in beautiful surroundings, but also of grueling low-paid work in hot dusty fields or sprawling industrial zones. These poles of desirability are highly correlated with the climate, much more so than in other places, even ones that are more unequal. The wealthy are concentrated along the coast, monopolizing access to cool weather and fresh clean air off of the ocean, while poorer people (sadly, often this means people of color) live disproportionately in the Central Valley, Inland Empire, and interior deserts, with their hot summers and perennial smog. The relatively more pleasant climate of some minority neighborhoods, like those in South LA, is offset by longstanding pollution and other environmental issues there. Where the wealthy do own property or spend time in sometimes-adverse areas, like the Coachella Valley (home of Palm Springs), they tend to visit at the best times of year and have permanent dwellings elsewhere -- whereas workers in those communities stay there year-round and suffer through the entire summer at 40-45 C, often while working outside in sectors such as agriculture or property maintenance. A similar story plays out on a more-local level, for example with respect to street shade. In a climate where trees often require conscious planting or tending, the differences among neighborhoods in terms of resources (and in city priorities) are on stark display. As in the below two images I've captured of a urban swath south of downtown LA, the relative wealth of an area can be ascertained with reasonable accuracy even from space. These features lead to localized heat stress and the associated impacts. While a given heat wave in California may have a larger impact along the coast, due to the rarity of extreme heat there, this must be weighed against the much higher absolute temperatures inland.  Satellite view of northern Long Beach, CA and surrounding areas. Source: Google Earth. 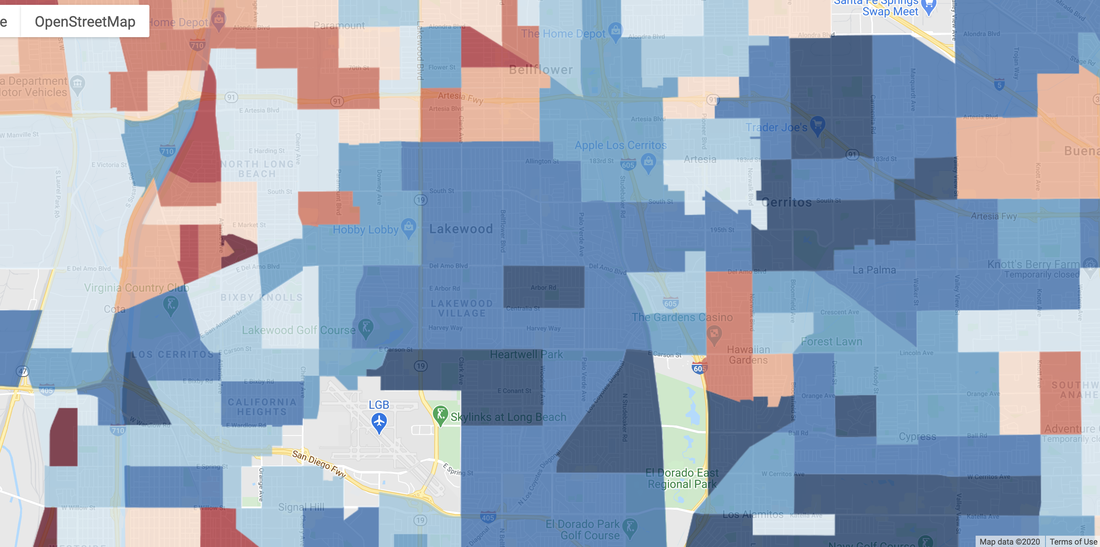 Same area but showing median income per census tract, ranging from dark blue (highest) to dark red (lowest). Source: justicemap.org. People with means have always sought out the most naturally desirable parts of a metropolitan region, whether that is the western (upwind) neighborhoods of mid-latitude cities or elevated neighborhoods away from docks, factories, and mosquito breeding areas. In California, the topography and coastline create large differences in climate over small distances, heightening the contrast. Restrictive zoning has further increased property values and reinforced this climate/income correlation by pushing lower-cost housing to the urban fringes, where heat, drought, and fire are more serious concerns.
However, a countervailing trend that has become apparent in recent years is that of the owners of expensive properties who would rather invest large sums for protection against climate-related hazards than sell and move elsewhere. This is happening in Malibu (despite recent wildfires), Montecito (despite recent mudslides), and Newport Beach (despite ongoing sea-level rise). Evidently, it will take repeated disasters to change mindsets, if at all, regarding the overall desirability of the coast. Another component of the calculation is that within urbanized areas (as opposed to the wildland-urban interface) fires are quite rare, and mudslides and sea-level rise threaten a relatively small number of properties, whereas heat, drought, and air pollution affect large areas all at once. And even when exposures are similar, socioeconomic factors cause greater vulnerability among poorer communities, such as through their lower levels of insurance coverage, resulting in very long shadows of impacts from disasters. Many of California's challenges, from homelessness to climate change, hinge on affordable and equitable housing. Achieving this will require a certain innovativeness, graciousness, and progressiveness that is hard to realize anywhere. There must first be a broader recognition of the endemic de facto environmental/climatic segregation here, and how it worsens overall health and economic outcomes. Erasing such distinctions is of course impossible, but taking a completely laissez-faire approach is itself an active choice, and one whose short-sightedness climate-related stressors will likely continue to demonstrate over the coming years.
0 Comments
The ongoing, decades-long integration of non-atmospheric components into climate science takes many forms. This reflects increasing recognition of the two-way interactions by which climate impacts both modulate and are modulated by culturally based decisions, demographic vulnerabilities, societies' financial resources and technical capabilities, and so on. Simultaneously, the emphasis on mean change from the early IPCC reports has given way to a diverse bouquet of illustrations of how rare and geographically patchy conditions cause the lion's share of impacts in just about every way that we care about: health, ecosystems, economies, and societies. Even among extreme events, it is often multifaceted ones (or combinations of them) that are responsible for the most severe damages. These 'compound' events can result from intrinsic physical processes (as with the tight relationship between heat and drought in many places, or a single storm affecting coastal water levels in several ways), or from the more or less random co-occurrence of two events in close spatial or temporal proximity (e.g. wildfires followed at a lag of weeks or months by heavy rain). Sector-specific analyses, e.g. for food, hydrology, or insurance, have gone a step beyond physical hazards, by diving deep into relevant locations, actors, and relationships that affect risks. Along with work by the natural-hazards community, these studies have refined the concept of 'risk' to now encompass a nuanced portrait of how individual and sociocultural characteristics ('societal drivers') and physical characteristics ('climatic drivers') combine and interact to produce the observed impact from an observed event. Inspired by such ideas, in May 2019 I and others hosted a workshop at Columbia University exploring the dual frontiers of (1) characteristics of interacting extreme events and (2) how they affect human societies. 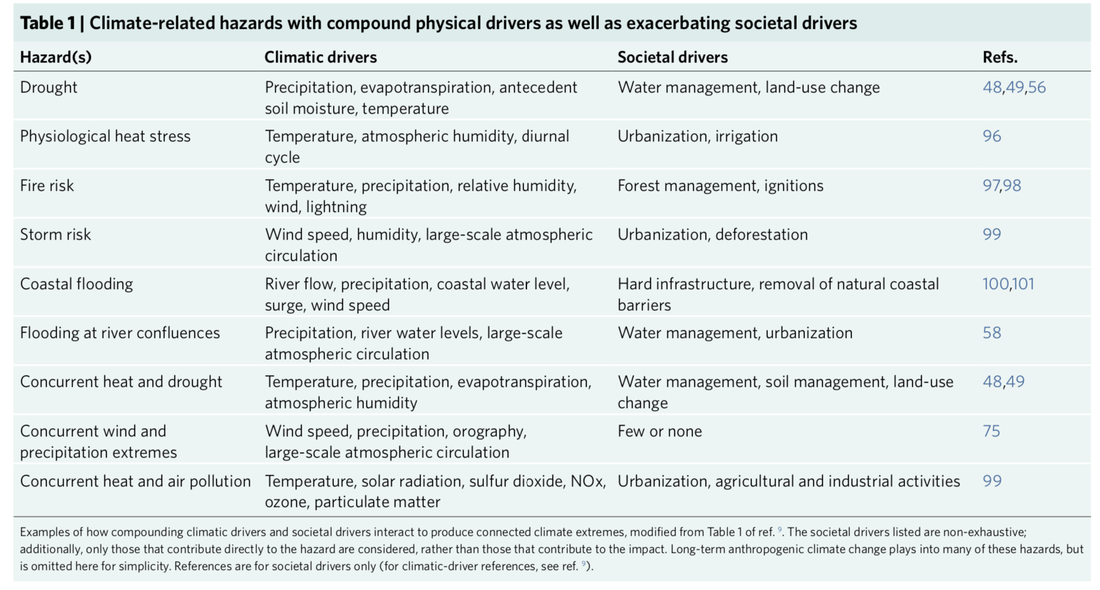 Our new paper builds on some of the main threads of the workshop, but adds in what had been an overlooked element: how human decisions can amplify impacts relative to what they could have been, and in some cases can even feed back onto the severity of the event itself. In the terminology that we propose, these societal drivers transform an event (or event sequence) from being 'compound' to 'connected'; that is, interactions between events or event components can occur regardless of whether their physical hazards compound or not. The example we describe in the most detail -- because it was recent, well-documented, and catastrophic for those who were shortchanged -- revolves around Hurricane Maria's impacts on Puerto Rico in 2017. The island's existing vulnerabilities in terms of infrastructure and emergency-response systems were already laid bare when Hurricane Irma struck weeks earlier; Category 5 Maria added to the misery. But beyond that, bureaucratic inefficiencies and resource limitations on the part of the Federal Emergency Management Agency made for a slow and painful recovery, ultimately magnifying the long-term costs. Once the (admittedly complex) prototype is understood, examples abound. Multiple-breadbasket failure, for instance? Its likelihood is implicitly defined by, and thus modulated by, the places where crops are grown (and this could be changed in the future). Large wildfires primed by naturally dry years and climate-change-aggravated summertime heat? They're also primed by untrimmed vegetation, aging equipment, and land-use policies that allow or even encourage population growth in canyons and hills. In fact, the below figure from the paper illustrates how peaks in the timeseries of damages from four major types of extreme events are all straightforward to explain using this framework.  Paper figure 2: Major losses caused by extreme climate events over 1980-2019 and their connective elements, among tropical cyclones (green), floods (blue), droughts (orange), and wildfires (red). Annotations in high-loss years state some of the (first row) climatic and (second row) societal drivers that shaped the total impacts. Loss data are from Aon, Catastrophe Insight Division. In the course of writing the paper, we realized that intricacies of the type described above are not at all rare. They may only seem so because data limitations, and the intimidating nature of the multiple feedback loops that can be present, have restricted the number of reports that directly reference such interactions. However, it does not take much supposition to conclude that connected extreme events are an important and fertile area spanning the intersection of climate science, engineering, and the social sciences, and one for which we recommend some principles for effective research based on our author team's researcher and practitioner expertises. Chief among these is the recognition that, to be actionable, climate information must be provided in a way that is directly congruous to existing decision-making pathways (for whatever the intended application). Studies focusing on even a slightly different area, timescale, or variable are nearly impossible for stakeholders to integrate, considering that they have many responsibilities and considerations outside of the climate domain, as well as legal mandates and financial limitations. In other words, collaborations that lead to important impact-relevant research share many characteristics with collaborations among scientists: they must be carefully and deliberately constructed; not suck up all of either party's time; rest on a solid foundation of trust; and be flexible enough to recognize each other's interests and strengths, yet firm enough to mutually shape them. Storylines, stress testing, and ethnographic surveys are some of the promising yet still sparsely employed techniques for identifying research questions that sit at the junction of what can happen, what can be found, and what a decision-maker needs to know when it comes to connected extreme events.
Notwithstanding the topic's early stage, we conclude the paper on a note of optimism, relating that similar challenges have been successfully met in other contexts, and that it takes only having a sufficient incentive for people to come together and devise improvements to a functional but suboptimal status quo. The increasing severity and frequency of many types of climate extremes, resulting in a continual stream of new combinations of impactful and hard-to-predict idiosyncratic connections, hopefully provide that basis. Even without improved forecasts or projections per se, we are convinced that investing in better awareness about and allocation of resources for connected extreme events is more than worthwhile if it enables responses to them that result in recovery, innovation, and increased resilience going forward, rather than degradation of human and financial capital and a perverse widening of inequalities. In the virtual pages of Science Advances today appears a study by Tom Matthews, Radley Horton, and me reporting advances in knowledge of the historical record of heat-humidity extremes. In this post I'll discuss some of the key findings, my thoughts about how they fit into the broader scientific context, and the kinds of future work that they help incentivize. The study is making some headlines probably because the concept of a wet-bulb temperature so high that it physiologically cannot be withstood for prolonged periods of time captures people's imaginations, but we have been careful to point out that the bulk of the work (as well as the novelty) rests in the story about values that are still extreme but decisively below this level. For instance, 33C corresponds to a temperature of 40C accompanied by a dewpoint temperature of 31C, and even 31C (which has occurred about 7,500 times globally over 40 years) exceeds the all-time maximum in the notoriously humid Washington, DC metropolitan area. These values preferentially occur in South Asia and select portions of Mexico, the Middle East, Australia, and East Asia. As published, in fact, the station dataset HadISD contains significantly more such extreme values (including dozens of exceedances of 35C), but we progressively eliminated many of these with additional quality-control measures ranging from temporal and spatial consistency checks (against the station itself, other stations, and reanalysis) to removing any dewpoint temperatures above the widely-reported 35C dewpoint recorded in Dhahran, Saudi Arabia in July 2003. We also dug deep into possible instrumental and observer errors. The result is what we consider to be a conservative estimate of global frequency and intensity -- keeping in mind that many of the stations record at 3- or 6-hourly intervals, rather than hourly, and also the paucity of good-quality observations in many global hotspots such as the Sahel; Iran and Pakistan; and East Africa. 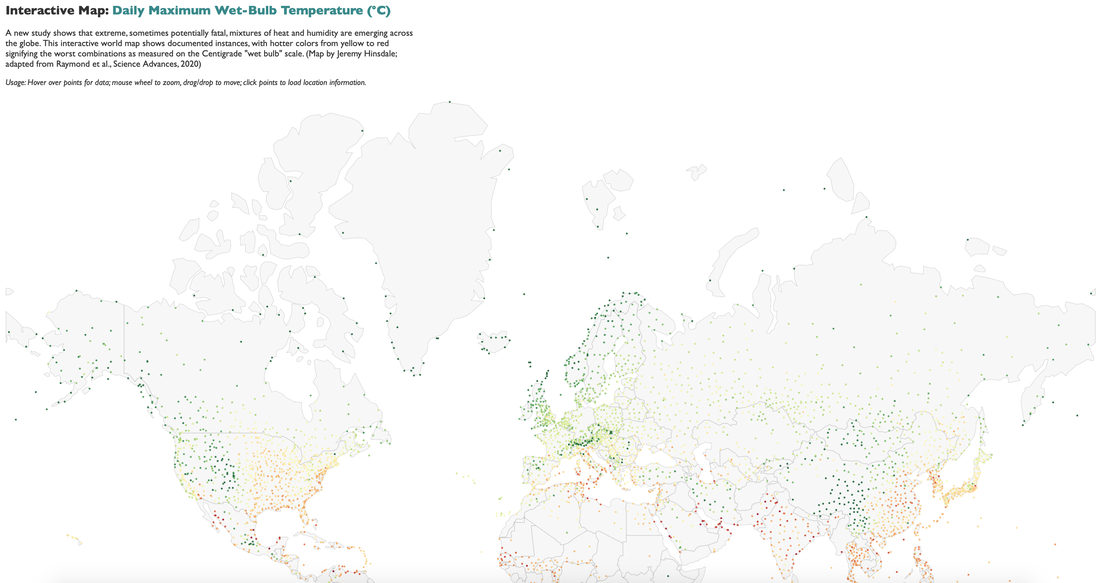 Screenshot of interactive map of 99.9th percentile of historical wet-bulb temperature at each station, produced by Jeremy Hinsdale at the Columbia University Earth Institute. Every threshold value except for the exceedingly rare 35C has experienced at least a doubling in frequency since 1979, underscoring the tight and nonlinear relationship between global mean temperature and extreme heat. This creates an alarming prospect in a world where temperatures are rising rapidly. Expanding the reach of artificial cooling (in the form of air conditioning) serves as an obvious solution in the short term, but looking forward, the inevitability of further increases is a sobering reminder of the importance of both mitigation of the temperature rise, and adaptation to what's already in store. Architecture, urban & regional planning, and national policies around farming and land use could play important roles on the adaptation side, but need to be guided by highly region- and season-specific knowledge in order to be effective. For instance, in South Asia prior to the onset of the summer monsoon, wet-bulb extremes are driven primarily by excessive temperatures (~45C or higher), whereas afterwards they occur in conjunction with greater relative humidity but lower temperatures (more like 37C). This difference could lead to policies that prioritize reducing heat in spring, and reducing humidity in summer, while remaining cognizant of the many constraints on behavioral changes, such as the need of farmers to irrigate at specific times within the growing season. 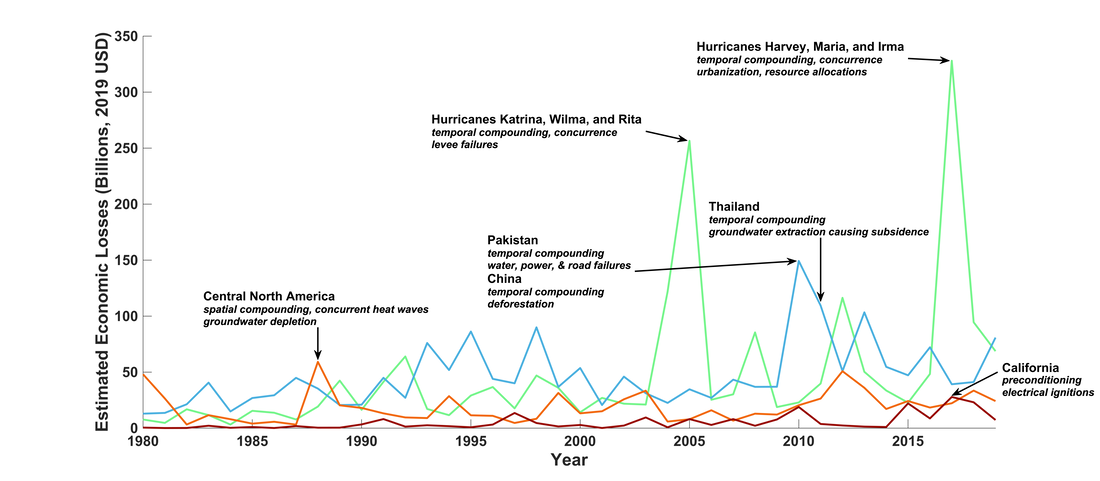 Global trends in extreme humid heat. (A-D) Annual global counts of TW exceedances above the thresholds labeled on the respective panel, from HadISD (black, right axes, with units of station-days), and ERA-Interim grid points (gray, left axes, with units of grid-point-days). We consider only HadISD stations with at least 50% data availability over 1979-2017. Correlations between the series are annotated in the top left of each panel, and dotted lines highlight linear trends. (E) Annual global maximum TW in ERA-Interim. (F) The line plot shows global mean annual temperature anomalies (relative to 1850-1879) according to HadCRUT4, which we use to approximate each year's observed warming since pre-industrial; circles indicate HadISD station occurrences of TW exceeding 35°C, with radius linearly proportional to global annual count. This study does not so much increase our knowledge about the future as it does about the past. Specifically, it improves our understanding of the historical baseline and the details of the brief 'spikes' that it contains. While extremes of any variable are more intense when looking at small spatial and temporal scales, we were particularly surprised by the steepness of the horizontal and vertical gradients of wet-bulb temperature in places like the Persian Gulf and Gulf of California. During the most severe events, the dropoff as seen by radiosondes ascending from 995 to 975 mb (150 to 310 m) averages 5C or more! This is consistent with the expectation from the two powerful competing forces that shape extreme heat in these arid regions: a source of moisture, itself at high temperatures, sitting underneath a near-constant large-scale high-pressure system which acts to trap heat and moisture close to the surface. Under the right meteorological conditions (e.g. a continuous onshore flow, plus maybe some other anomalies which future work will need to establish), the sun beats down and moist static energy builds and builds in a shallow boundary layer with no means of escape. The small scales and brief times at which this occurs -- before being dissipated by some modest amount of horizontal or vertical mixing, for example -- make it very difficult for models or reanalyses to capture it with appropriate severity. ERA5 does a much better job than ERA-Interim, but the underestimates still generally exceed 2 deg C. Where the spatiotemporal scales of the extremes are larger, such as in the interior eastern United States, these reanalyses are right on the money. 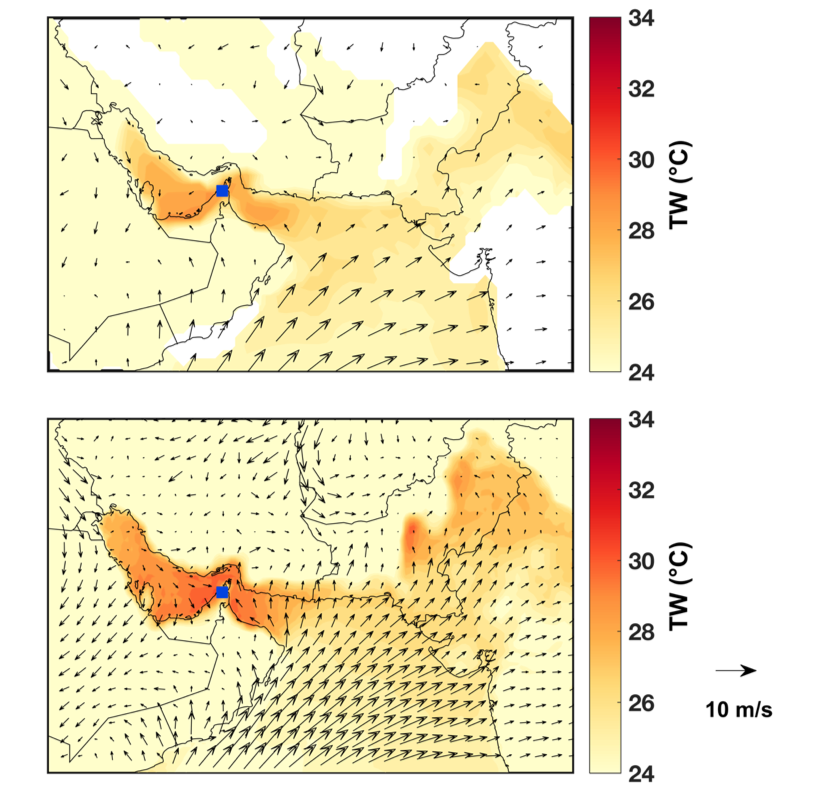 Meteorological conditions when TW=35°C. (Top) ERA-Interim composite of 10-m winds and 2-m TW on the n=4 days when TW=35°C was recorded at Ras al-Khaimah, UAE (blue square). Resolution of plotted data is 0.5°x0.5° and 6-hourly. (Bottom) Same as top but for ERA5. Resolution of plotted data is 0.25°x0.25° and 1-hourly. Mean TW daily maximum near station location is 28.7°C for ERA-Interim and 30.8°C for ERA5. 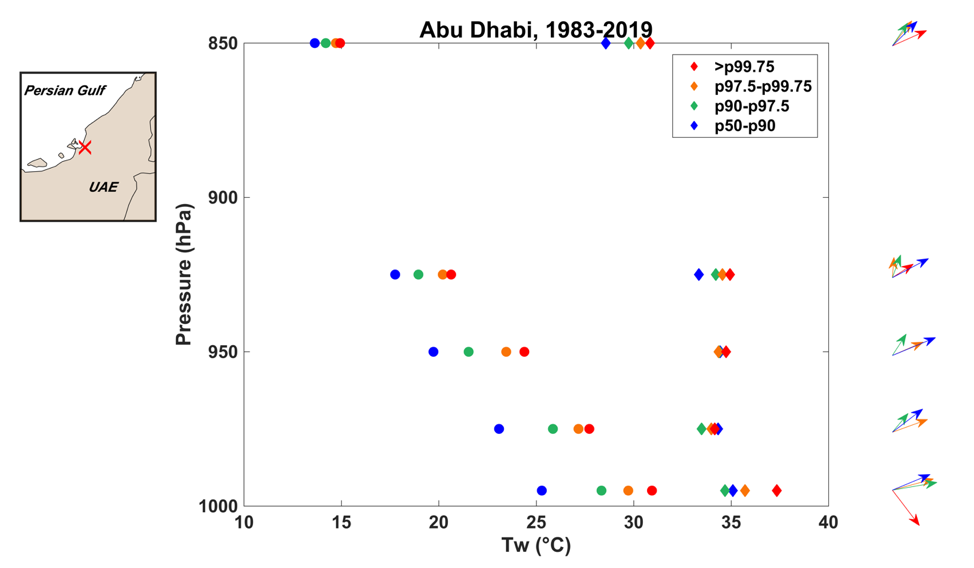 Vertical profiles of coastal extreme humid heat. Radiosonde temperature (diamonds) and TW (circles) for Abu Dhabi International Airport, United Arab Emirates at 12Z on all days between 1983 and 2019 with a lowest-level TW value greater than the annual 99.75th percentile (red, 10 days); between the annual 97.5th and 99.75th percentiles (orange, 90 days); between the annual 90th and 97.5th percentiles (green, 298 days); and between the annual 50th and 90th percentiles (blue, 1593 days). Profiles are truncated at 850 hPa for visibility. Vectors on the right-hand side indicate composite wind speed and direction on these days for each height bin, where available; the map on the left-hand side is a 2.5x2.5 box indicating the location of the launch site. There remains much we do not know about the ingredients and impacts of these exceptionally rare events. How are they affected by irrigation or other land-cover change? By urbanization? By short-term variations in sea-surface temperature? By meteorological conditions such as monsoon progression or passing weather systems? Given the generally larger importance of humidity in producing the 'spikes' that we see, should more attention be focused on limiting extreme humidity rather than extreme temperature? Our paper hints at some hypotheses about these factors, but does not definitively establish or quantify them, especially in terms of how they may work together in varying combinations to affect extreme wet-bulb temperatures in one region versus another.
Ultimately, speaking for Radley and Tom as well as myself, we see our paper fitting neatly within the structure of the running conversation begun by hot-water-immersion tests in the early and mid 20th century, emerging definitively in the climate literature with Sherwood and Huber 2010, and continuing recently with papers by Pal and Eltahir, Im et al., and others. We hope that this robust conversation broadens and continues, evolving such that even as the leading edge of these extremes push beyond levels seen in the Holocene, human ingenuity and compassion find ways to forestall disasters in the near-term, and to develop policies and technologies in the medium- and long-term, that look holistically at this 'wicked' problem and chip away at the socioeconomic vulnerabilities, consumption habits, and development geographies that exacerbate it. A personal, subjective attempt at summarizing the top climate stories and advances of the decade that has been: Climate models continued to prove very good at predicting global temperature change from greenhouse-gas forcings, and total emissions continued to track the top-line emissions scenario. Temperature increases led to 8 of the decade's 10 years ranking in the top 10 warmest years since 1850. A recent review paper looking back at studies from the late 20th century found that even the simpler, coarser-resolution models then in use predicted temperature changes entirely consistent with what has since been observed. The similarity across generations of models gives further confidence to global-average statistics such as mean annual temperature changes. It is sobering but not at all surprising, given the strength of the economic, social, and political status quo, that efforts such as the Paris Agreement of 2015 have not yet made any appreciable dent in the irrepressible upward track of greenhouse-gas *emissions* (not to mention concentrations), and thus that global-average temperature records continue to be broken left and right. 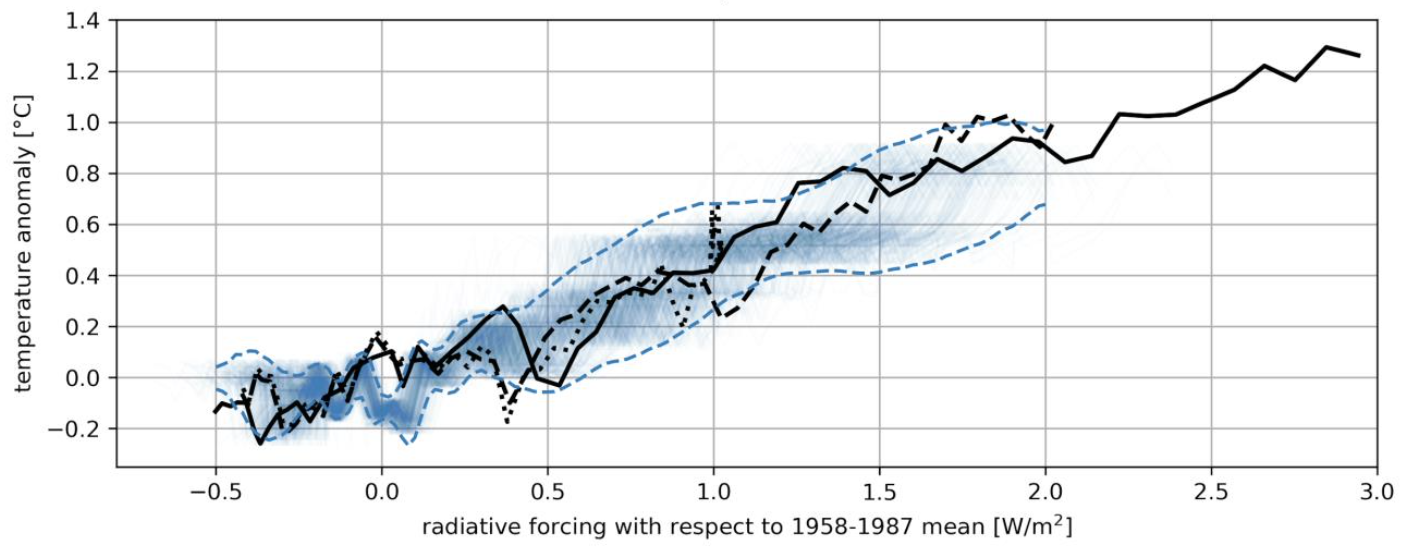 Projections of global-temperature changes as a function of radiative-forcing changes for three scenarios from Hansen et al. (1988) and in observations from the past 30 years (area between blue dashed lines). Source: Hausfather et al., 2019. A variety of severe extreme events, often distinguished by their long durations, inspired new efforts to understand and mitigate them. Several such events made their mark on the arc of history by striking wealthy and/or populated areas, rather than by their geophysical rarity. These included the 2010 Russian heatwave, 2010 Pakistan floods, 2010-11 Queensland floods, 2011 Thailand floods, 2012 Midwest drought and heatwave, 2012 Hurricane Sandy, 2014 and 2015 US Midwest and Northeast cold snaps, 2015 and 2018 European heatwaves, 2017 Hurricanes Harvey, Irma, and Maria, 2017-2019 California wildfires, and ongoing 2019 Australia bushfires. Some were notable more for highlighting to physical scientists aspects of climate variability or change that were previously underappreciated (such as the much larger rainfall amounts associated with slow-moving tropical cyclones, or the mid-latitude effects of Arctic sea-ice melt), while others made headlines for their dramatic economic or ecological effects (such as the vulnerability of international supply chains to floods or storms). The now-ubiquitous Internet, and in particular social media, enhanced the power of some events by making the visual evidence of them compelling and unavoidable. Areas from agriculture to international trade to urban planning were increasingly shaped by the recognition that these kinds of extreme weather and climate events pose major (and in many cases growing) risks which it is imperative to address. 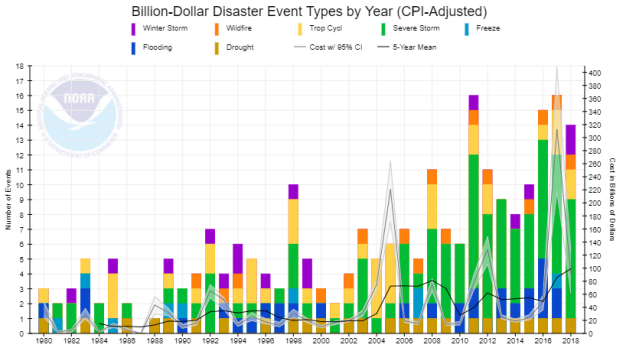 A summary of US billion-dollar weather-related disasters since 1980. Source: https://www.climate.gov/news-features/blogs/beyond-data/2018s-billion-dollar-disasters-context Weather and climate computer models enabled qualitative as well as quantitative improvements in representing the Earth system, across a spectrum from basic research to public-facing operational forecasts. Probabilistic forecasts of storm surge and fluvial flooding hour by hour and house by house. Continuous global 3-km hourly weather forecasts. Quantifications of how the land surface affects the development of individual severe storms. Near-real-time estimates of the fractional contribution of anthropogenic effects on the characteristics of a natural disaster. Robust partitioning of observed regional climate changes into deforestation, irrigation, urbanization, global greenhouse gases, and major modes of variability. All of these were well beyond the limit of scientific and computational capability before the 2010s, but have now come into their own. A safe bet is that the 2020s will see many more such successes, each of which allows us to see 'around a corner' that had previously been blind. The pipeline from research to operations moves haltingly, but on a decadal basis the progress is clear, even if in ways that don't garner much publicity. And now, on to the 2020s! They present at the same time the largest-ever opportunity for human development and for furthered understanding of the physical climate (and how the two-way links between it and societies function), as well as the largest-ever risks from the potential misallocation of financial and intellectual resources in the face of rapid ongoing changes. As the world continues to become larger and more complicated, a certain level (even minimal) of harmony and collaboration within and among the international research and policy communities would greatly ease our ability to constructively manage the enormous task that we have effectively set out for ourselves as a species: to be, for the foreseeable future, active and conscientious guardians of an entire planet.
|
Archives
September 2023
Categories |
 RSS Feed